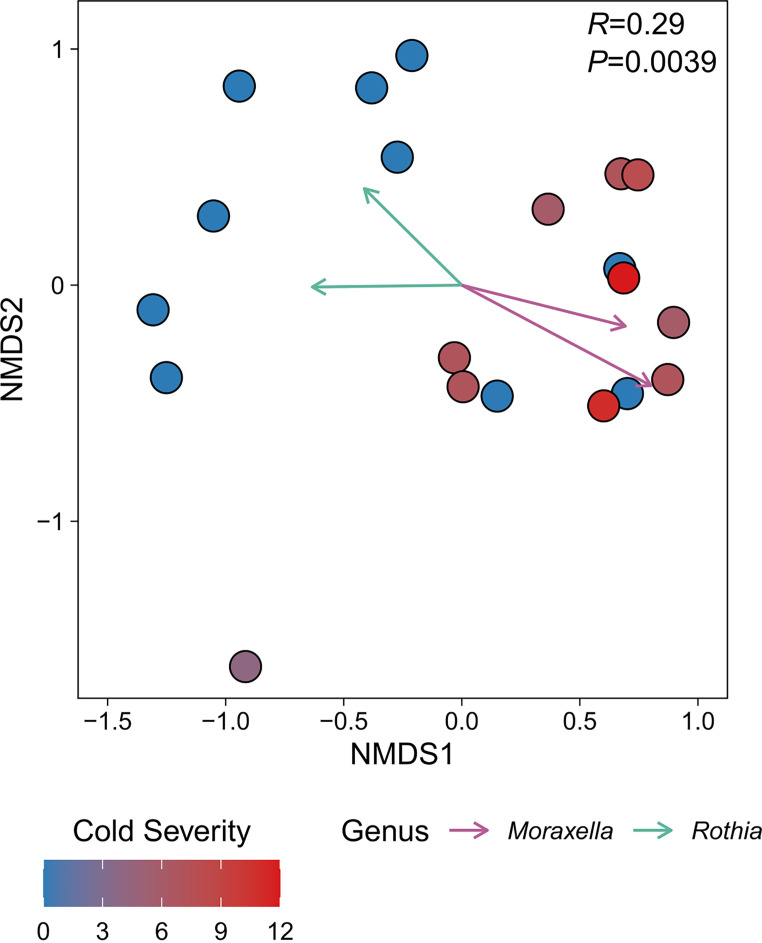
FIG 1.
Bacterial community composition varies between children based on Moraxella colonization and correlates with cold severity. Each point in the nonmetric multidimensional scaling (NMDS) plot represents the bacterial community sequenced from one individual. Points are colored according to cold severity score (see Materials and Methods), as indicated by the key in the lower left. Vectors represent operational taxonomic units (OTUs) corresponding to either Moraxella or Rothia. Each vector originates from 0,0 and indicates a significant (α = 0.05) trend for select OTUs and their length is scaled according to the square root of their correlation coefficients such that longer vectors indicate stronger correlations. Vectors are colored by their genus-level identification, as indicated by the key in the lower right. The ANOSIM R and P values (100,000 permutations) for comparing children with upper respiratory tract infection symptoms (cold severity score > 0) with healthy children (cold severity score = 0) are shown in the top right of the plot. The stress value for the NMDS plot was 0.14.

