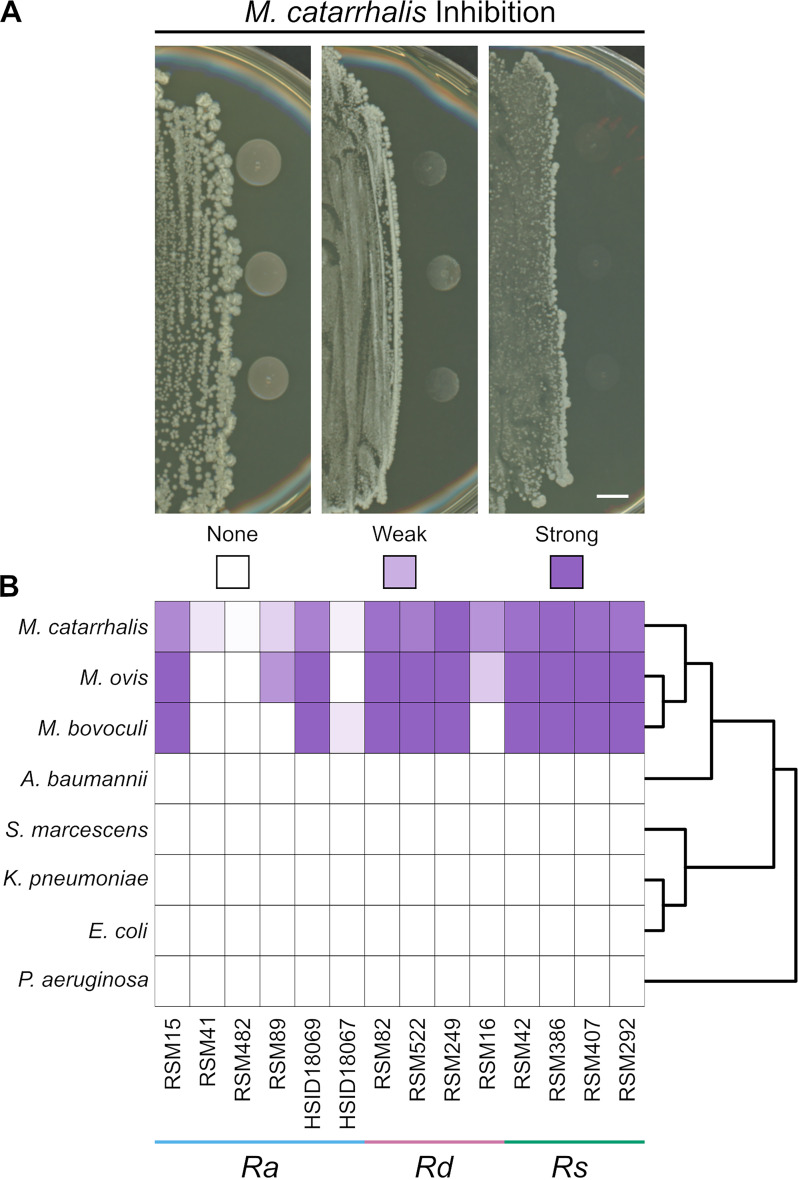
FIG 2.
Inhibition of Moraxella catarrhalis by Rothia. (A) Cocultures of Rothia isolates (left side of image) and three colonies of M. catarrhalis strain O35E (right side of image) The inhibition score is indicated below each image, with the heat map key shown in panel B. Photographs were taken after co-incubation overnight on brain heart infusion (BHI) agar and are representative of ≥3 replicates. For M. catarrhalis, the inhibition score represents the aggregate for six different strains. See Fig. S1 for the results of each M. catarrhalis strain individually. Scale bar = 5 mm. (B) Heat map shows the inhibition scores of each Gammaproteobacteria strain (left) when paired with the corresponding Rothia isolate (below). Each interaction was replicated ≥3 times and the inhibition scores were averaged. Right side shows cladogram of the Gammaproteobacteria strains used in this study. Abbreviations: Ra, R. aeria; Rd, R. dentocariosa; Rs, R. similmucilaginosa.

