FIG 4.
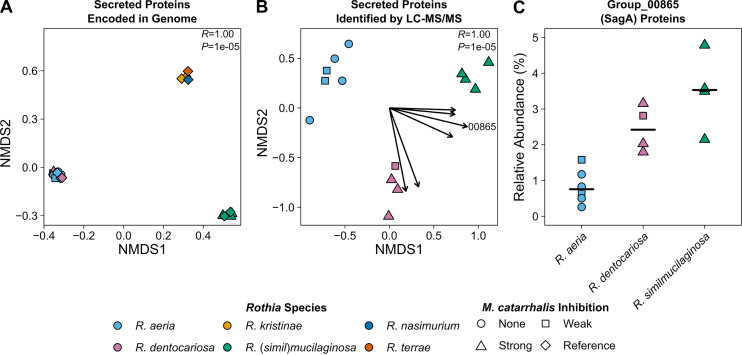
The secreted proteomes of Rothia vary by species. (A) Each point in the NMDS plot represents the presence or absence of 448 groups of homologous proteins with predicted secretion signals within a single Rothia genome. Points have been jittered to avoid overplotting. The ANOSIM R and P values (100,000 permutations) for comparing species are shown in the top right of the plot. The stress value for the NMDS plot was 1e–04. (B) Proteins secreted into agar by Rothia were extracted and identified using untargeted liquid chromatography-tandem mass spectrometry (LC-MS/MS). Each point in the NMDS plot represents the relative abundance of 181 groups of homologous proteins with predicted secretion signals detected within a single proteome. Each vector originates from 0,0 and indicates a significant (α = 0.05) trend for a subset of homologous proteins (Table 1), and their length is scaled according to the square root of their correlation coefficients such that longer vectors indicate stronger correlations. The vector for group_00865 (SagA) is labeled. The ANOSIM R and P values (100,000 permutations) for comparing species are shown in the top right of the plot. The stress value of the NMDS plot was 0.084. (C) The relative abundance of homolog group_00865, which corresponds to SagA (secreted antigen A), in the secreted proteomes of Rothia grouped by species. Horizontal black bars indicate the median relative abundance values. The points in all plots are colored based on the species-level identification and the shapes correspond to the M. catarrhalis inhibition phenotype, as indicated by the key below the plots.

