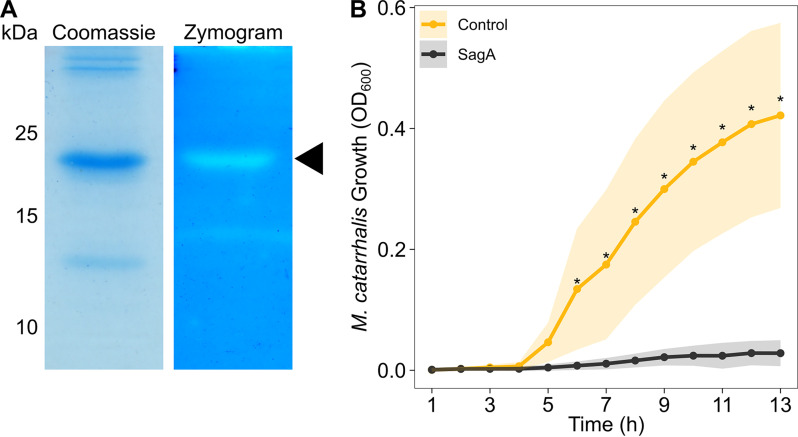
FIG 5.
SagA inhibits M. catarrhalis through peptidoglycan degradation. (A) Two μg of partially purified 6×His-SagA37-197 was loaded onto a standard polyacrylamide gel stained with Coomassie brilliant blue G-250 (left) or onto a zymogram gel stained with methylene blue (right). For the zymogram gel, peptidoglycan from M. catarrhalis strain O35E was incorporated during polymerization. Peptidoglycan degradation is indicated by clearing in the zymogram gel. Molecular weight markers in kDa are shown to the left. The 6×His-SagA37-197 protein band is indicated with a triangle. Gels are representative of triplicate experiments. Note, the gel images were scaled to the same size. (B) Growth curve of M. catarrhalis strain O35E cultured for 13 h in the presence of 6×His-SagA37-197 (black) or an equivalent extract purified from E. coli harboring an empty pBAD30 plasmid (gold). Each inhibition assay was repeated with four separate preparations and two technical replicates. Points represent the average optical density at 600 nm (OD600) at each time point and shading indicates standard error. Asterisks (*) indicate time points at which a Wilcoxon rank-sum test demonstrated a significant difference (α = 0.05) in growth between the control and the culture exposed to 6×His-SagA37-197.

