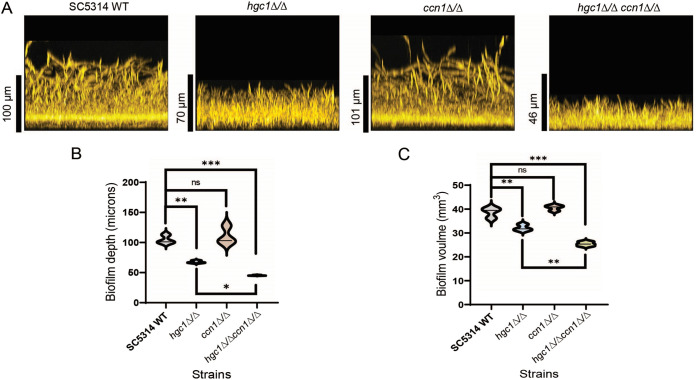
FIG 7.
Genetic interaction between HGC1 and CCN1. (A) Biofilm side view projections. Wild-type SC5314, hgc1Δ/Δ, ccn1Δ/Δ, and hgc1Δ/Δ ccn1Δ/Δ strains were assayed for biofilm formation in RPMI plus 10% serum at 37°C for 24 h (96-well plate). Fixed biofilms were stained using calcofluor white and imaged using a Keyence BZ-X800E fluorescence microscope. Representative side view images are shown, and the vertical scale bar represents 100 μm in length. (B and C) Violin plots showing the biofilm depth (in micrometers) and volume (in cubic millimeters) distributions of the indicated strains, respectively. Biofilm depth and volume were measured with the software ImageJ. The significant differences were calculated between the pair of means using Sidak’s multicomparison test: *, P < 0.05; **, P < 0.01; ***, P < 0.00; ns, P > 0.05.

