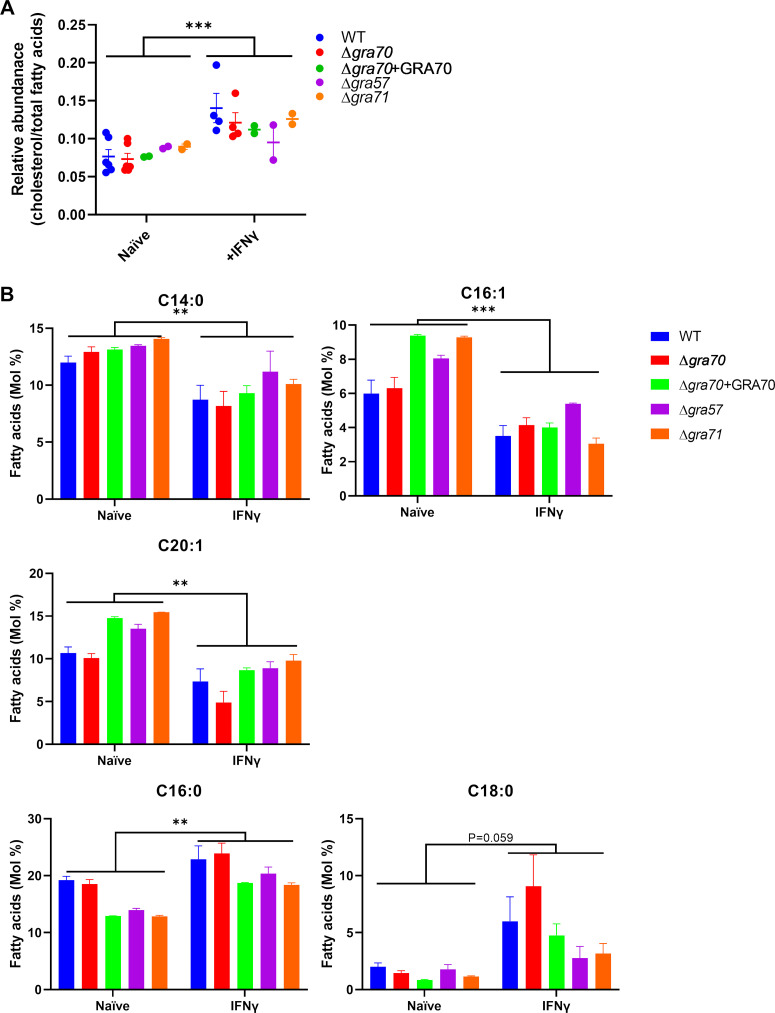
FIG 4.
Lipidomic analyses on Δgra57, Δgra70, and Δgra71 using GC-MS-based approaches. (A) Lipidomics analysis comparing relative abundance of cholesterol over total fatty acids in WT and indicated knockout and complemented parasites grown in naive or IFNγ-stimulated HFFs. Indicated are means ± SEM (n = 2 to 4). P values were calculated using 2-way ANOVA with Sidak’s multiple-comparison test. (B) Fatty acid composition in Mol %. P values were calculated with a mixed-effects model with Sidak’s multiple-comparison test. n = 6 to 8 for WT and Δgra70, n = 2 for Δgra57, Δgra71, and Δgra70+GRA70. *, P < 0.05; **, P < 0.01; ***, P < 0.001.

