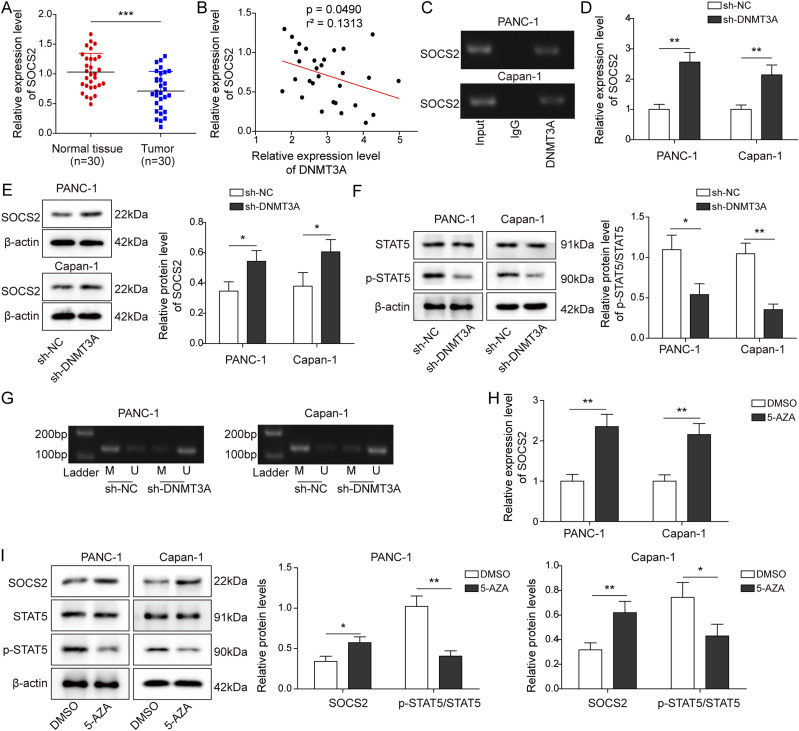
Figure 3. DNMT3A-mediated DNA methylation regulated the expression of SOCS2 in pancreatic cancer cells.
(A) qRT-PCR analysis of SOCS2 expression in PC and normal tissues (n = 30). (B) The correlation between SOCS2 and DNMT3A. (C) ChIP assay of the SOCS2 promoter region was performed with PANC-1 and Capan-1 cells by anti-DNMT3A antibody to analyze the binding sequence between DNMT3A and SOCS2 promoter. (D, E) qRT-PCR and Western blot measured the expression of SOCS2 after DNMT3A knockdown. (F) Western blot analysis of the phosphorylation level of STAT5, which was identified as a downstream gene of SOCS2. (G) Methylation levels in the SOCS2 promoter were measured by methylation-specific PCR with unmethylated (U) and methylated (M) primers after DNMT3A knockdown. (H, I) To analyze the effect of methylation on SOCS2 levels, demethylating agent 5-AZA was treated with PC cells. qRT-PCR and Western blot were used to detect SOCS2 expression and the phosphorylation level of STAT5, respectively. *P < 0.05, **P < 0.01, and ***P < 0.001.

