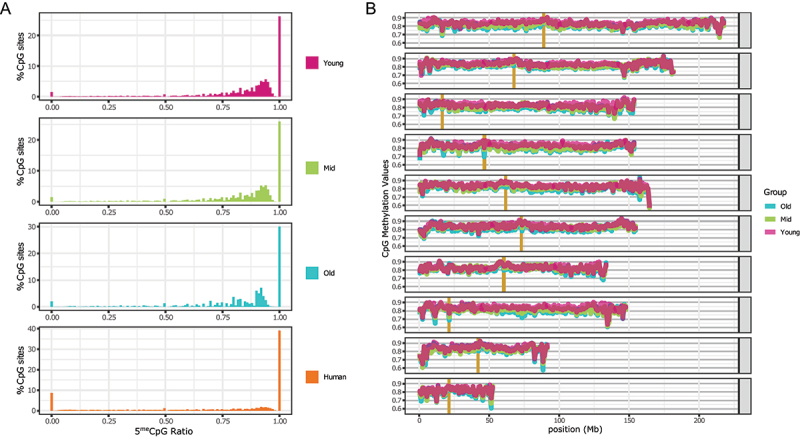
Figure 1.

Cytosine methylation levels in CpG context.
(A) Distribution for X. tropicalis of three different age groups and human mammary epithelial tissue. For each X. tropicalis age group the average of three different individuals. Common sites with at least 5× coverage were used. The human mammary epithelial dataset is from ENCODE (doi:10.17989/ENCSR656TQD, file ENCFF699GKH).
(B) CpG methylation distribution over chromosomes for each age group (average of all samples within the same group). Vertical gold bars represent centromere positions. Common sites for all samples with at least 3× coverage were used. Resolution 500Kb.
