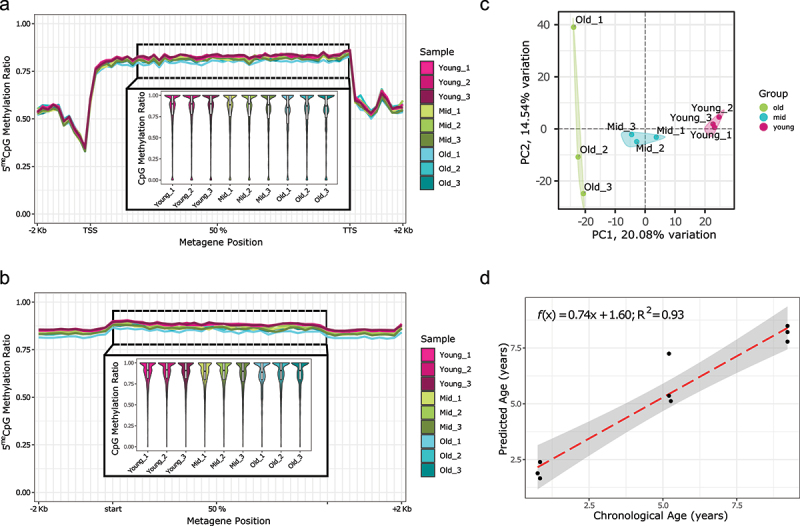
Figure 2.

CpG methylation distribution over genomic features.
(A) Gene metaplot with upstream and downstream 2Kb. In the inset, a zoom in of the central part of the gene body (from the second decile to the TTS).
(B) Gene body CpG methylation in repeated elements bigger than 1Kb [not distinguished by class nor family].
(C) Principal Component Analysis (showing PC1 vs. PC2) using CpG methylation levels for the nine frog samples. CpG sites with at least 5× coverage were used and filtered to remove the variables with low variance (PCAtools, removeVar = 0.1).
(D) CpG methylation preliminary clock leave-one-out predictions. Each point represents the age prediction on one sample from an elastic net model which was trained on the other eight samples. For all panels, common sites for all samples with at least 5× coverage were used. The boxplots in the insets show the mean of the distribution.
