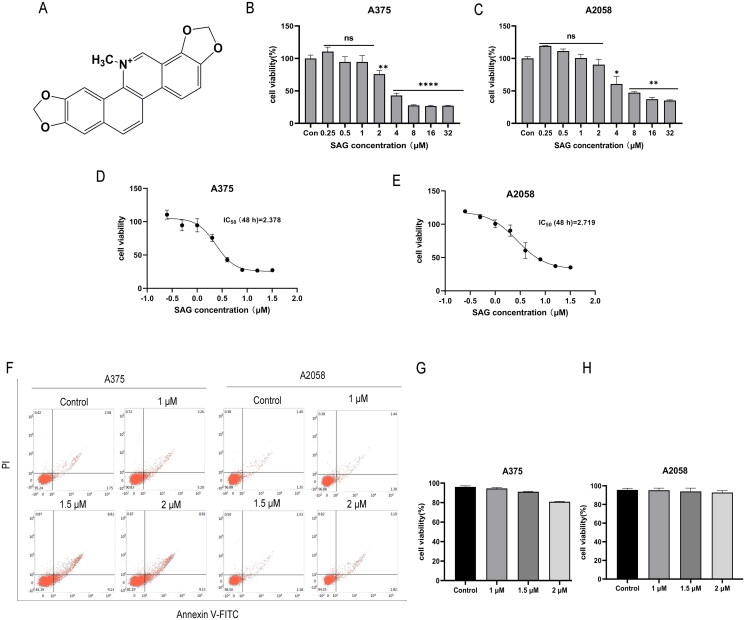
Figure 1.
(A) Chemical structure of SAG. (B and C) Effect of SAG on cell viability in A375 and A2058 cells. A375 and A2058 cells were treated with SAG for 48 h, and the 0.5% DMSO group was used as a control. (D and E) A375 and A2058 cells were treated with different concentrations of SAG or DMSO, and cell viability and the IC50 at 48 h were examined by CCK8 assay. (F-H) The results of flow cytometry showed there was no significant difference in the viability of the cells at each concentration of SAG. The data are shown as the mean ± SD of three independent experiments (*p < 0.05, **p < 0.01, as compared to the controls).

