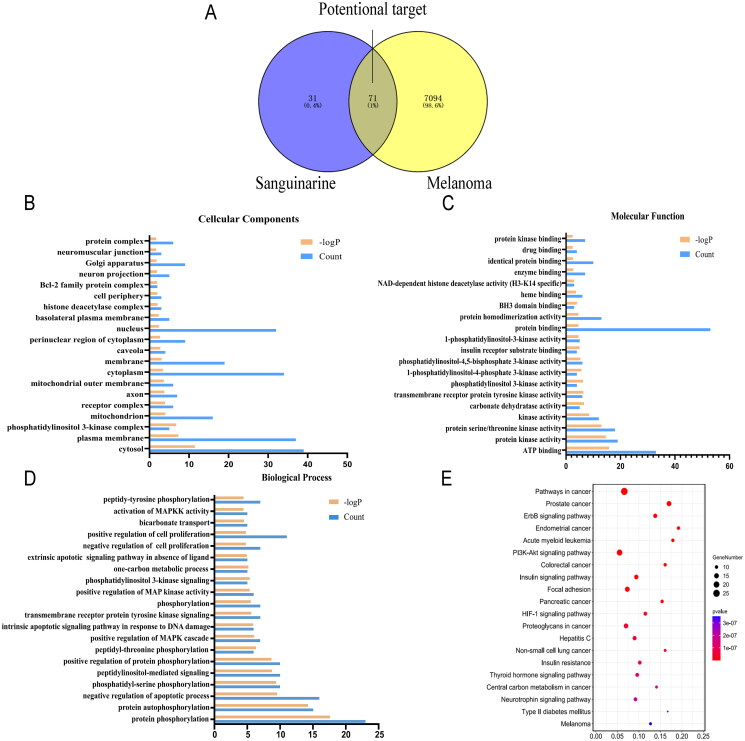
Figure 2.
Analysis of the melanoma-SAG-related targets and construction of the SAG-melanoma-target network: (A) The Venn diagram of SAG and melanoma intersection targets. (B-D) GO enrichment analysis of core target for SAG against melanoma. For (B) Cellular Components, (C) Molecular Function and (D) Biological Process, was shown in histograms. (E) Whole 20 enriched KEGG pathways of core targets for SAG against melanoma. The colour scales indicate the different thresholds of adjusted p-values, and the sizes of the dots represent the gene count of each term.

