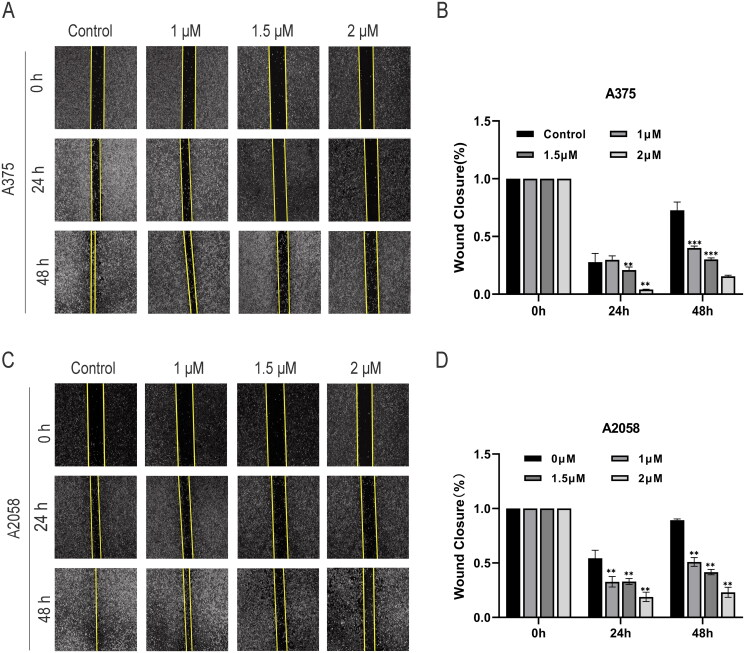
Figure 5.
(A-D) Effect of SAG on the migration of A375 and A2058 cells. The cells were cultured with different concentrations of SAG (0, 1, 1.5, 2 μM) for 48 h. Each scratch was photographed at 0 h, 24 h and 48 h. The histogram shows the closure rate of the scratches after 24 h and 48 h (*p < 0.05, ** p < 0.01, *** p < 0.001 as compared to the controls).

