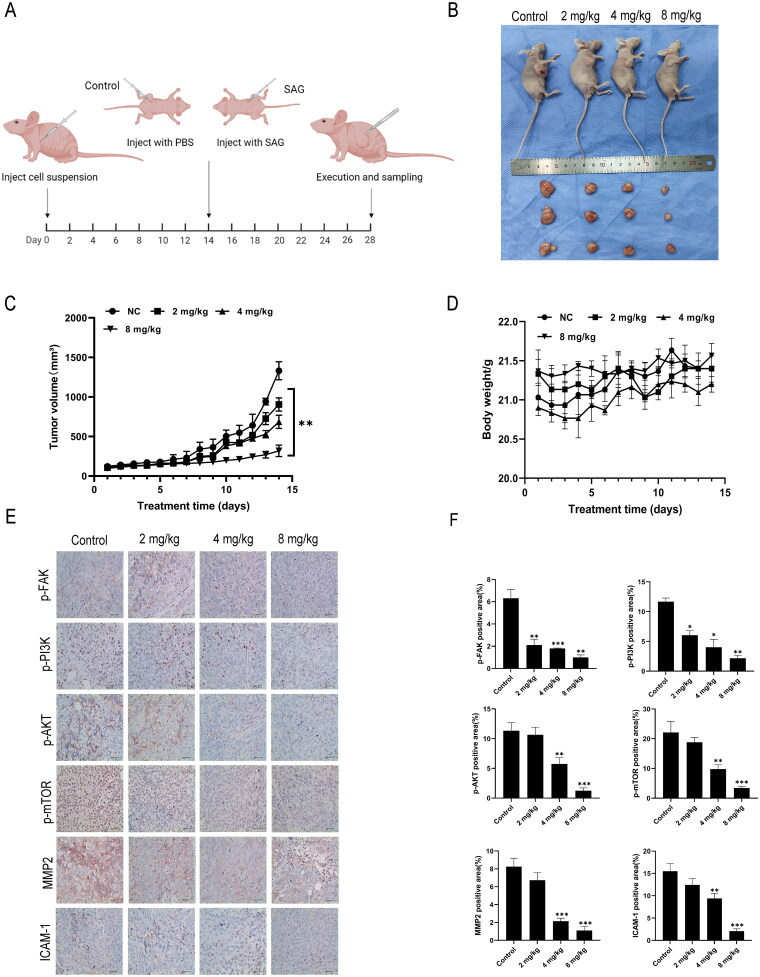
Figure 8.
SAG inhibited the growth of A375 cells in vivo. (A) The timeline for the mouse in vivo experimental details. (B and C) Nude mice were injected with different concentrations of SAG and tumour volumes were measured daily. Compared with the control group, the SAG-treated group significantly inhibited tumour growth. (D) The body weight of the mice was weighed daily, and there was no significant difference between the body weight of the SAG-treated group and the control group. (E and F) p-FAK, p-PI3K, p-AKT, p-mTOR, MMP2 and ICAM-1 were detected by immunohistochemistry, the expression levels were downregulated with the increasing SAG levels (*p < 0.05, **p < 0.01, ***p < 0.001, as compared to the controls).

