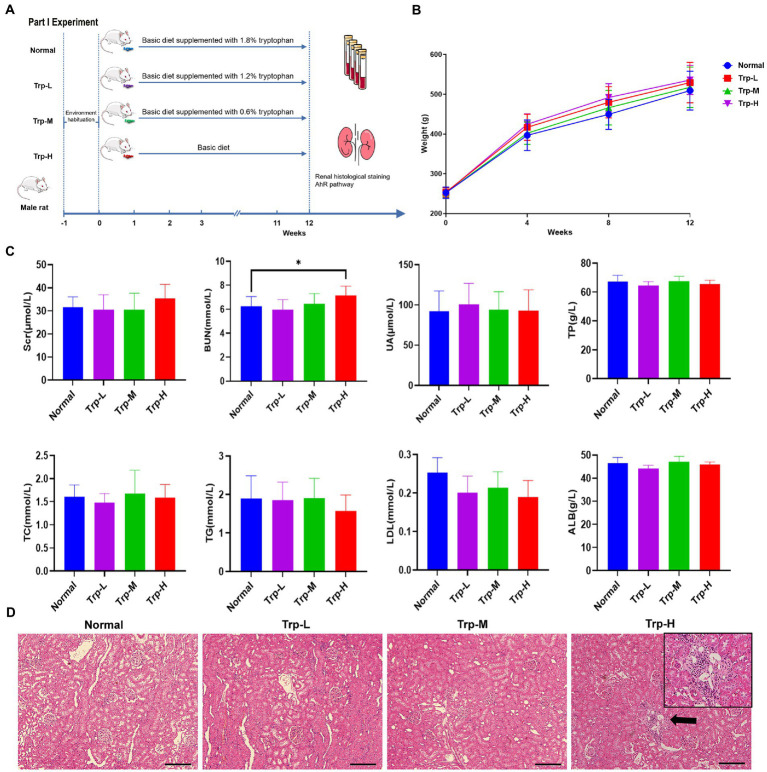
Figure 1.
Dietary tryptophan induced kidney injury phenotypes in healthy rats. (A) Schedule of Part I experiment. (B) Body weight. (C) Serum creatinine, blood urea nitrogen, uric acid, total protein, total cholesterol, triglyceride, low density lipoprotein, albumin. (D) Hematoxylin–eosin staining of kidney tissue (100×). The data are presented as the mean + standard deviation, n = 10 rats per group (*p < 0.05).

