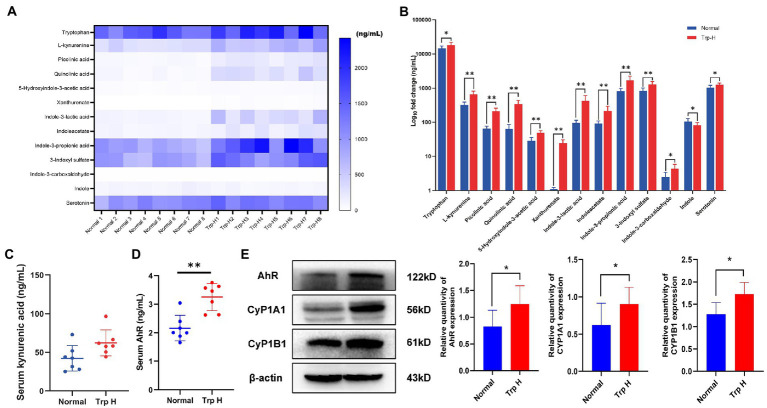
Figure 3.
Dietary tryptophan induced tryptophan metabolites accumulation and activation of AhR pathway. (A,B) The levels of tryptophan metabolites in serum (n = 8). (C) Serum kynurenic acid (n = 8). (D) Serum AhR (n = 7). (E) Western-blot analysis of AhR, CyP1A1, CyP1B1 expression in kidney tissue of rat with or without tryptophan diet (n = 8). The data are presented as the mean + standard deviation (*p < 0.05, **p < 0.01).

