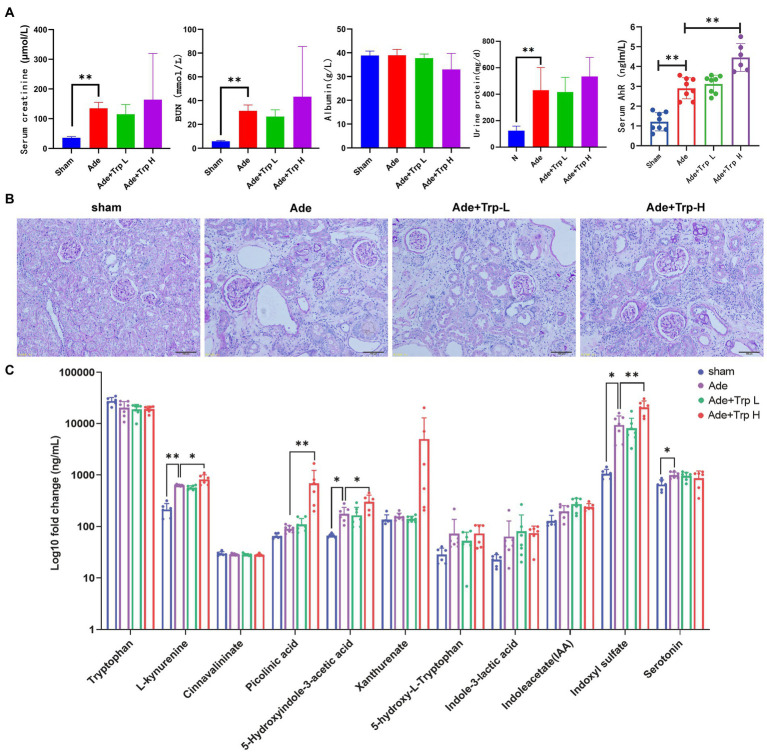
Figure 4.
Tryptophan induced Kyn/IS accumulation and AhR pathway activation in CKD rats. (A) Serum creatinine, blood urea nitrogen, albumin, urine protein and AhR. (B) Periodic acid–Schiff (PAS) staining of kidney tissue (100×). (C) The levels of tryptophan metabolites in serum (n = 6 in sham and Ade + Trp-H group, n = 7 in Ade and Ade + Trp-L group). The data are presented as the means + standard deviation (**p < 0.01).

