Figure 10.

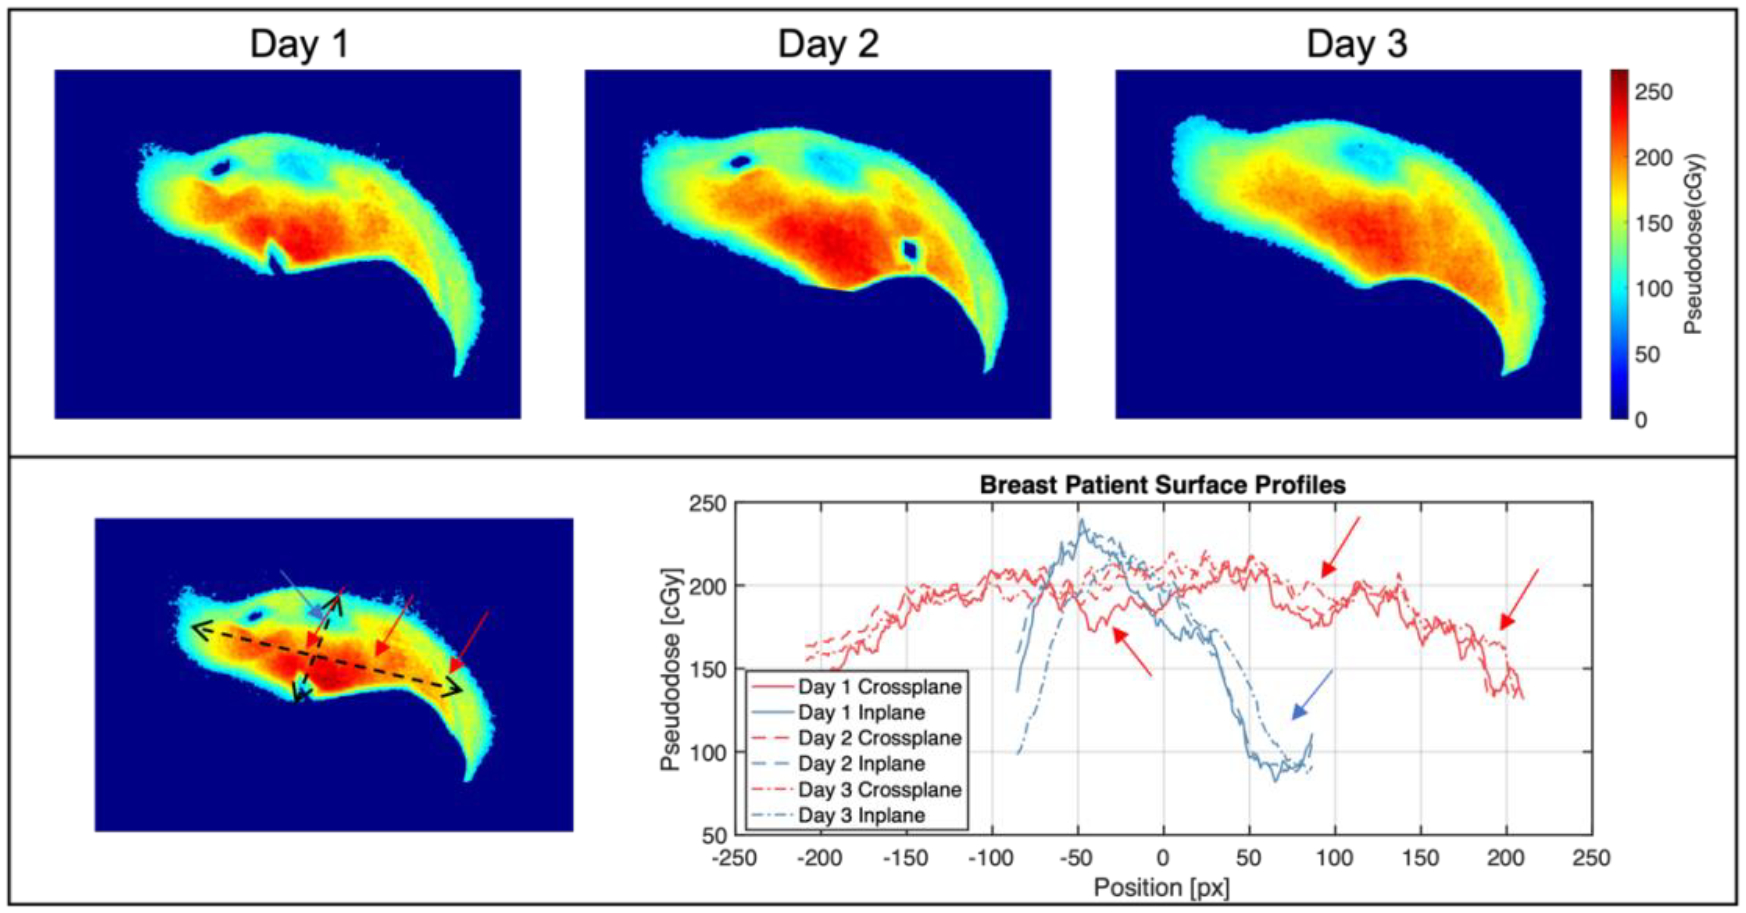
Top: Pseudodose maps from three fractions of patient 1 imaging on Halcyon. Bottom: Surface profiles from all three images, with arrows highlighting intensity dips from heterogeneous tissue attenuation.

Top: Pseudodose maps from three fractions of patient 1 imaging on Halcyon. Bottom: Surface profiles from all three images, with arrows highlighting intensity dips from heterogeneous tissue attenuation.