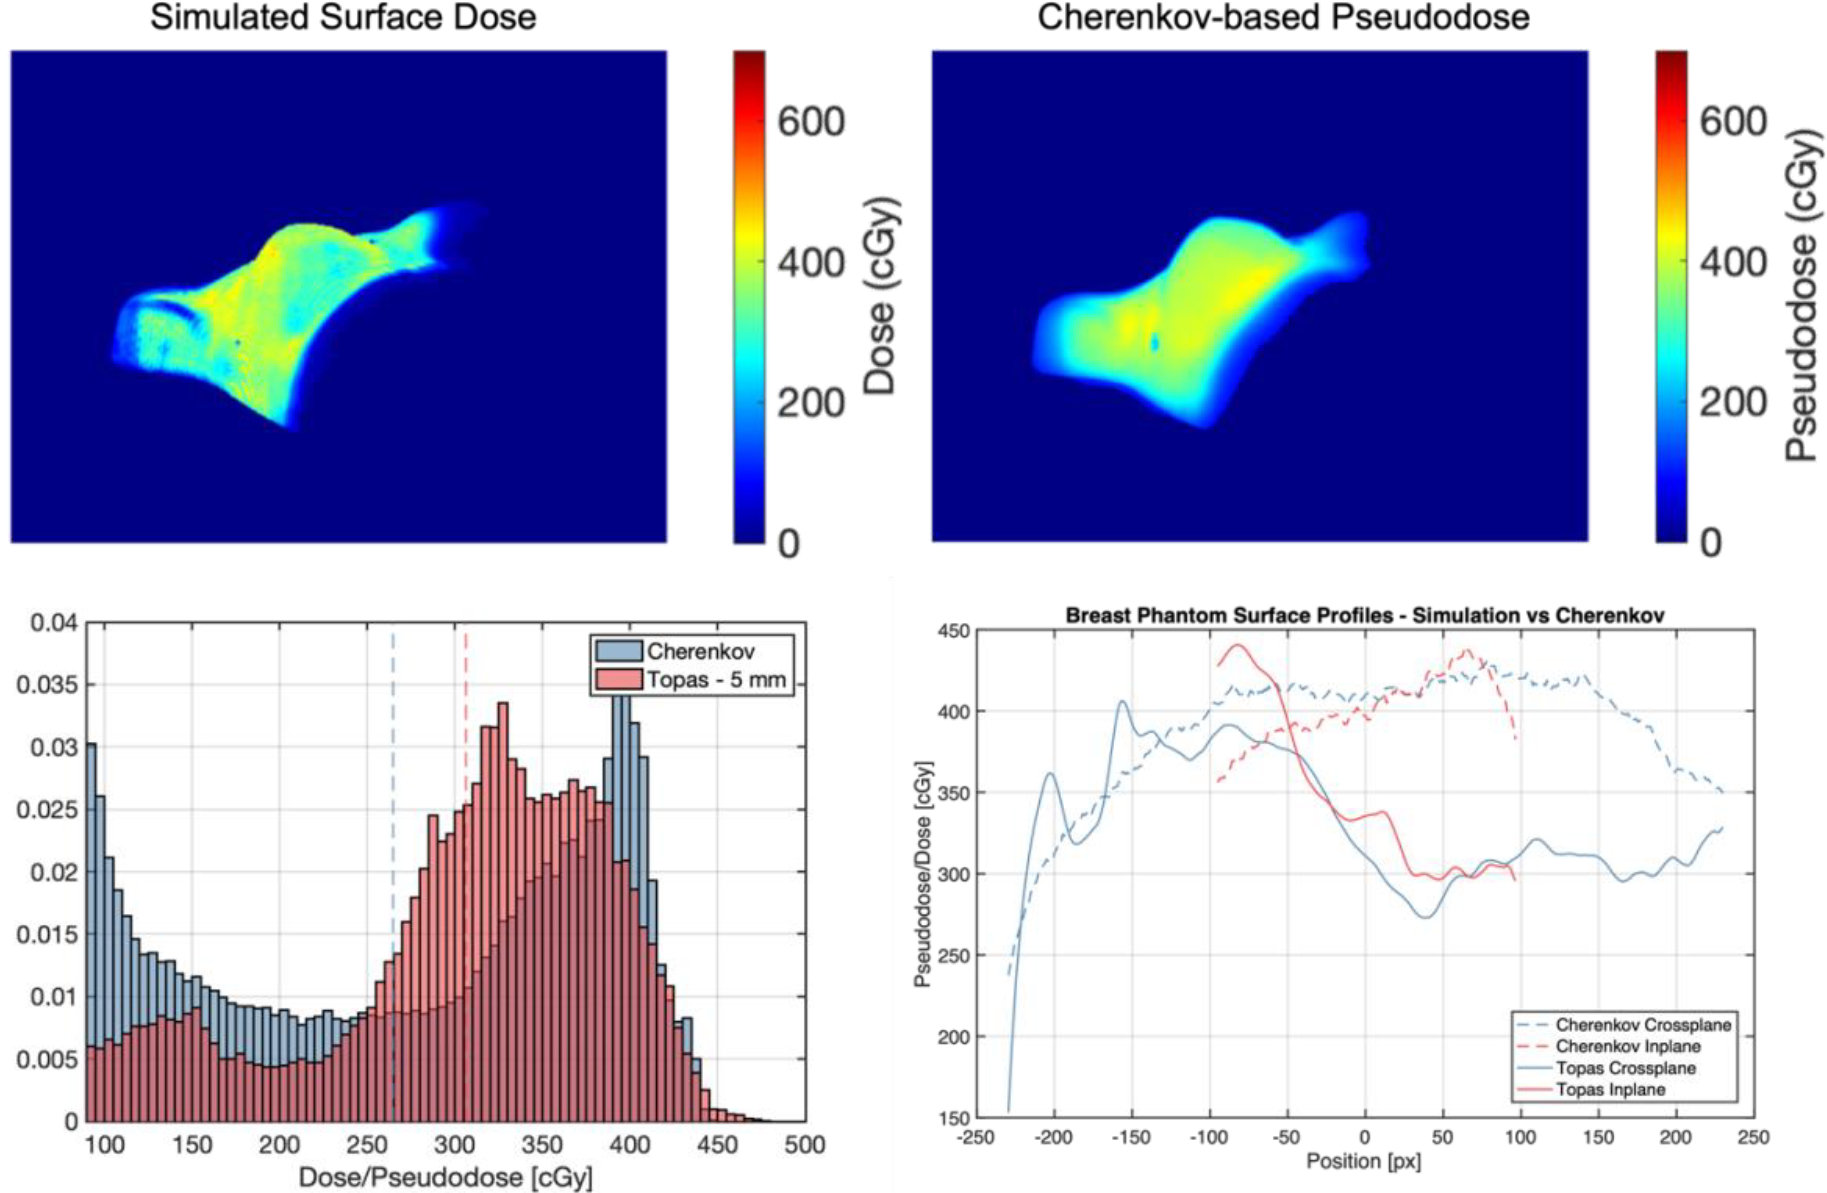
Figure 8.

Upper left: Simulated superficial dose sampled 5 mm down from surface of breast phantom. Upper right: Cherenkov-based pseudodose measured from images of TrueBeam plan delivery without MLC sequence. Bottom right: Histograms comparing simulated dose and pseudodose maps, with mean values shown as dotted lines. Bottom right: inplane and crossplane superficial profiles.
