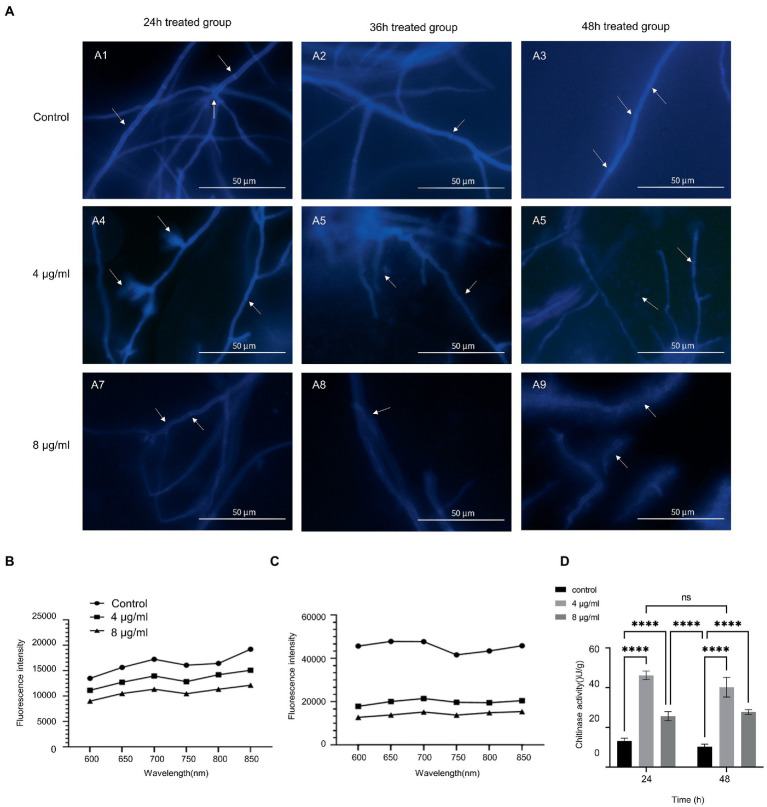
Figure 3.
Hinokitiol targeted the cell wall. (A) Calcofluor white staining. Fluorescence images were taken with a fluorescence microscope. (B,C) Congo red staining. Microplate reader with excitation and emission wavelengths of 540 and 600–850 nm, respectively. (D) Chitinase activity. (n = 3/group; ns P > 0.05, **** p < 0.0001).

