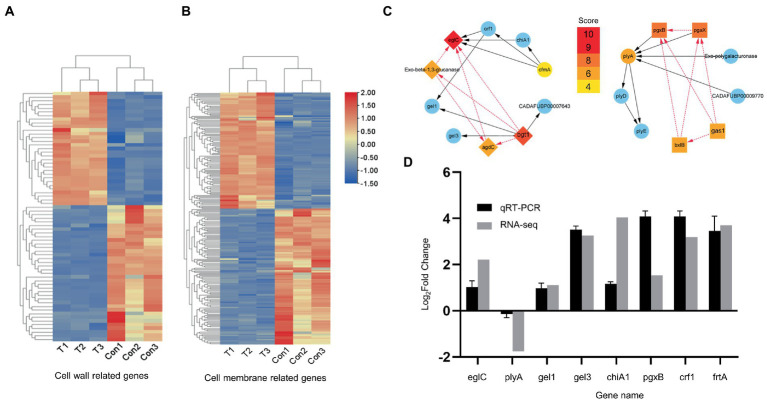
Figure 4.
RNA-seq analysis and qRT-RNA validation. (A,B) Heat maps. Related to the cell wall and cell membrane, respectively. (C) PPI network. Gene screening and STRING database analysis were performed on Hub genes in advance. (D) qRT-PCR validation. The up direction of bars represents increased expressions of genes and the down direction of bars means decreased expressions of genes.

