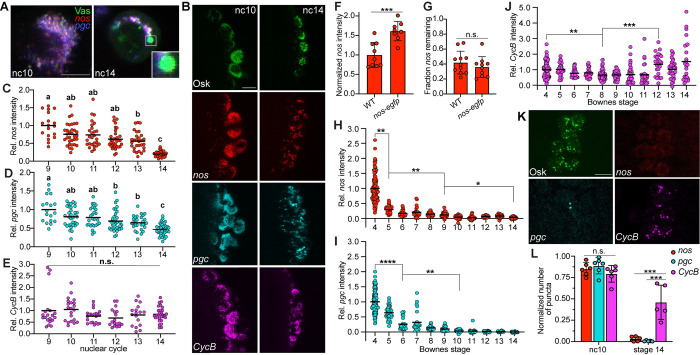
Fig 3. CycB mRNA is protected while nos and pgc mRNAs are degraded.
(A) Single confocal sections of a single representative pole cell at nc10 and nc14. nos (red) and pgc (blue) were detected by smFISH. Detection of direct fluorescence of Vas-EGFP (green) was used to mark germ granules. Enlargement shows an individual granule containing Vas protein without any nos or pgc at nc14. (B) Maximum intensity confocal z-projections of representative pole cells in nc10 and nc14 embryos. nos (red), pgc (cyan), and CycB (magenta) mRNAs were detected by smFISH. Anti-GFP immunofluorescence (Osk-sfGFP) or direct fluorescence of Vas-EGFP was used to mark germ granules (green) and detect protein levels. (C–E) Quantification of the fluorescence intensities of nos (C), pgc (D), and CycB (E) per pole cell relative to the fluorescence intensity of Osk or Vas at each nuclear cycle after pole cell budding begins. Values were normalized to nc9, n = 4–9 embryos per nc. Nuclear cycles that do not share a letter are significantly different as determined by Kruskal–Wallis one-way ANOVA with Dunn’s post hoc test (p < 0.05). (F, G) Quantification of total nos intensity in the germ plasm in wild-type and nos-egfp embryos at nc10-11 (F) and nc14 (G). Values were normalized to the wild type (F) and to nc10-11 values from the same genotype (G), respectively, n = 8–11 embryos per genotype. nos levels were compared by Student’s t test. (H–J) Quantification of the fluorescence intensities of nos (H), pgc (I), and CycB (J) per pole cell relative to the fluorescence intensity of Osk or Vas at each Bownes stage from pole cell formation to the end of pole cell migration. Values were normalized to stage 4, n = 4–24 embryos per stage. mRNA levels were compared by Kruskal–Wallis one-way ANOVA and Dunn’s multiple comparison test. (K) Maximum intensity confocal z-projections of representative pole cells in stage 14 embryos. Osk (green), nos (red), pgc (cyan), and CycB (magenta) were detected as in (B). (L) Quantification of the number of nos, pgc, and CycB puncta relative to the number of germ granules in nc10 and stage 14 embryos, n = 5–6 embryos per stage. One-way ANOVA with Tukey–Kramer post hoc tests were performed at each time point to compare the 3 mRNAs. Individual data points and mean (C–E, H–J) or mean ± SD (F, G, L) are shown. *p < 0.05, **p < 0.01, ***p < 0.001, ****p < 0.0001, and n.s., not significant. Source data for the graphs in Fig 3C–3J and 3L are provided in S1 Data. Scale bars: 10 μm. smFISH, single-molecule fluorescence in situ hybridization.

