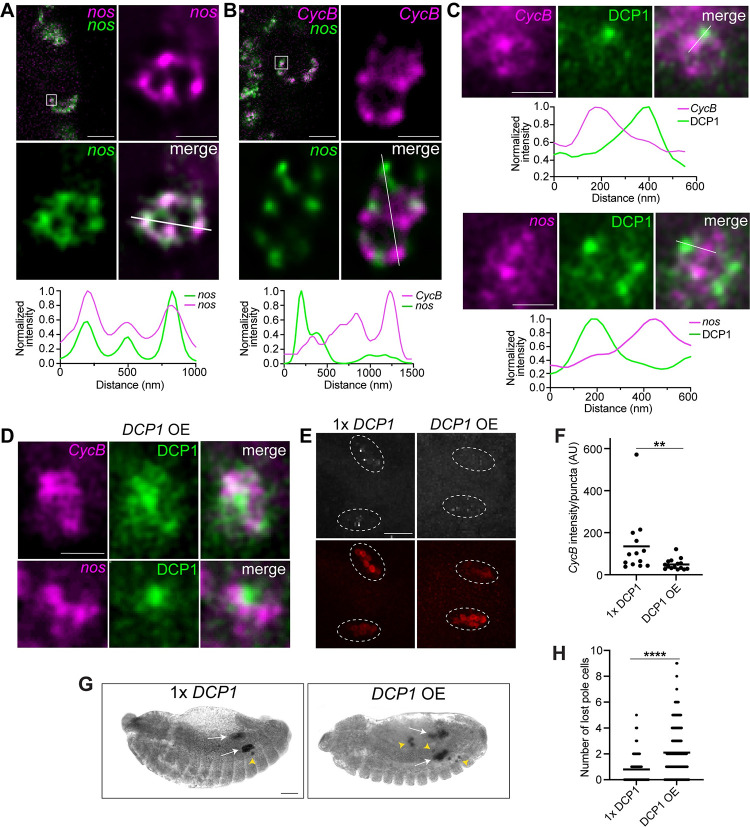
Fig 5. DCP1 localizes to puncta within germ granules that do not overlap with CycB or nos.
(A, B) The 2D STED images of individual germ granules (indicated by the white box on the confocal section shown in the upper left panels) from a pole cell at nc13 or 14: nos was detected using 2 different smFISH probe sets (green + magenta) in (A); nos (green) and CycB (magenta) were detected by smFISH in (B). Fluorescence intensity was measured along the path marked with a white line and intensity profiles of each channel, normalized to the maximum value, are plotted. (C) The 2D STED images of individual germ granules showing the distribution of DCP1 (green) relative to nos or CycB (magenta) in wild-type embryos. Fluorescence intensity profiles along the path indicated by the white lines are shown. (D) The 2D STED images of individual germ granules showing the distribution of DCP1 (green) relative to nos or CycB (magenta) in embryos overexpressing DCP1-smg3′UTR. In all images, DCP1 was detected by immunofluorescence. STED images were deconvolved using NIS-Elements software and the brightness and contrast were adjusted individually for each image in order to best show the distributions of the mRNAs or protein at that stage. (E) Maximum intensity confocal z-projections of CycB detected by smFISH (white), and Vas detected by anti-Vas immunofluorescence (red) in the gonads of embryos heterozygous for a DCP1 mutation (1× DCP1) and DCP1-smg3′UTR overexpression (DCP1 OE) embryos. White circles outline the regions of the gonads. (F) The average fluorescence intensity of CycB puncta per embryo was quantified using Imaris, n = 13–15 embryos per genotype. (G) DIC images of representative 1× DCP1 and DCP1 OE embryos. Pole cells were detected by anti-Vas immunohistochemistry. The gonads (white arrows) and lost pole cells (yellow arrow heads) are indicated. (H) Quantification of the number of lost pole cells per embryo at or after Bownes stage 14 from experiment in (G), n = 73–223 embryos per genotype. Individual data points and mean values are shown. **p < 0.01, ****p < 0.0001 according to Mann–Whitney test. Scale bars: 5 μm for confocal images, 500 nm for STED images (A–D); 50 μm (E, G). Source data for the graphs Fig 5A–5C, 5F and 5H are provided in S1 Data. smFISH, single-molecule fluorescence in situ hybridization; STED, stimulated emission depletion.

