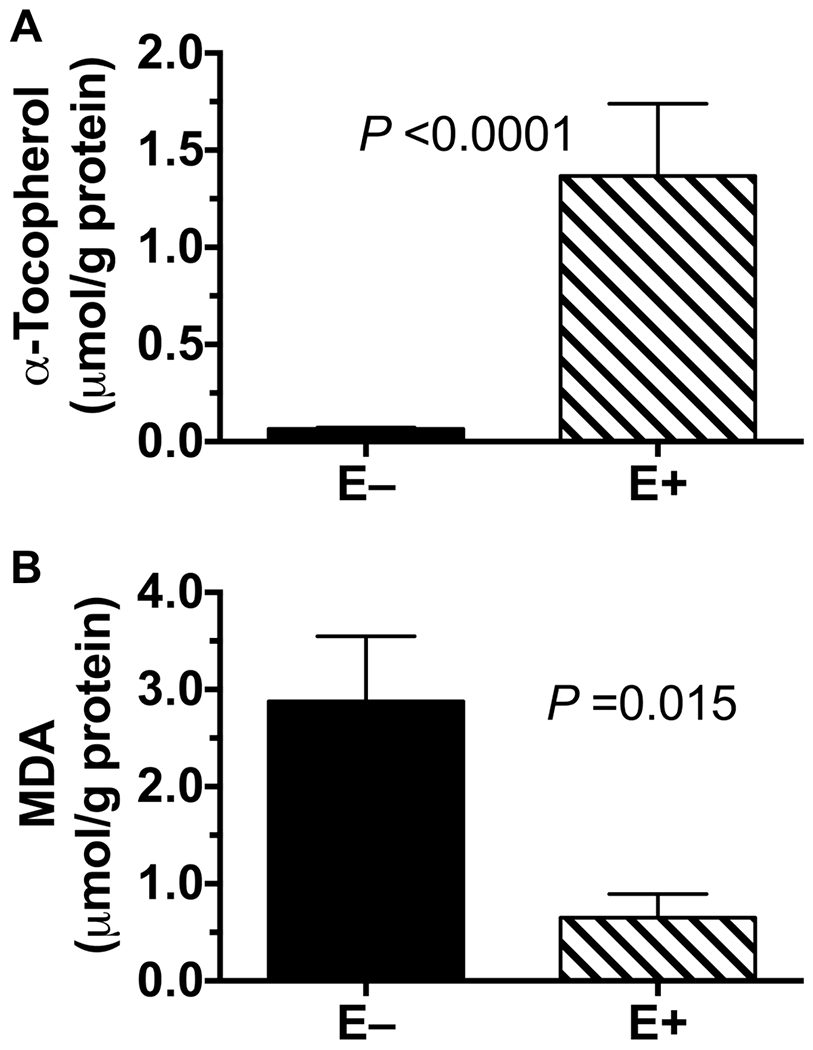
Figure 1: Liver Vitamin E Concentrations.

Livers from adult zebrafish fed in E+ (n=5) and E− (n=4) diets for 9 months were analyzed. α-Tocopherol (A) and malondialdehyde (MDA, B) are reported per protein (mean ± SEM, μmol/g). Statistical differences were evaluated using Student’s t-test and the logarithmic transformation of the data.
