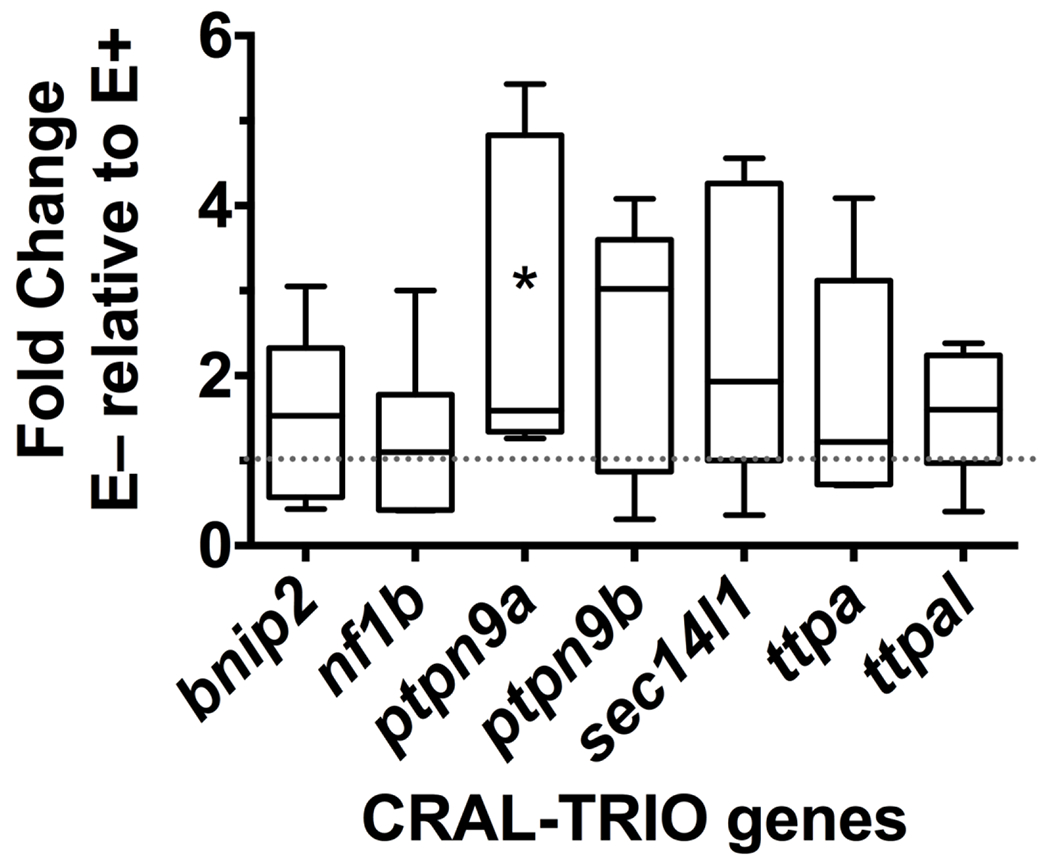
Figure 2: Relative gene expression of CRAL_TRIO genes.

Relative mRNA expression is shown as E− fold change relative to E+ (control, dotted line at 1). Boxes extend from 25th to 75th percentile, the whiskers range between 10-90%, line shown is the median, n = 7 per group. Only ptpn9a (*) was significantly different between E+ and E− livers (P=0.029). Abbreviations: BCL2 interacting protein 2 (bnip2); neurofibromin 1b (nf1b); protein tyrosine phosphatase non-receptor type 9a (ptpn9a); protein tyrosine phosphatase non-receptor type 9b (ptpn9b); SEC14-like lipid binding 1 (sec14l1); tocopherol (alpha) transfer protein (ttpa); tocopherol (alpha) transfer protein-like (ttpal).
