
Fig. 3.
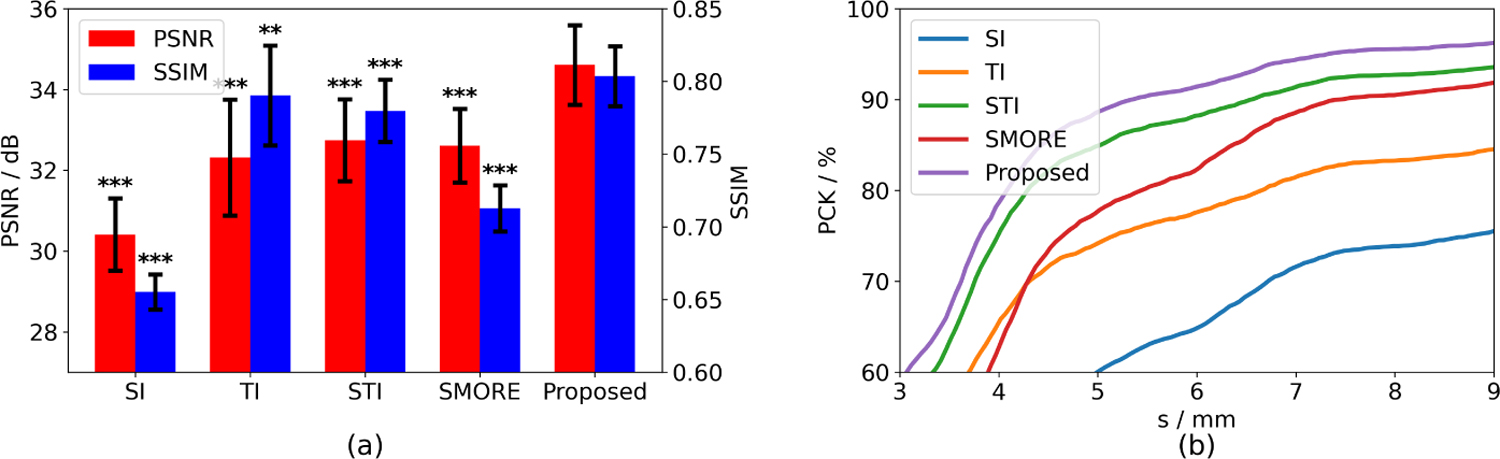
Evaluation of super-resolution results from fetal EPI data with NI = 4. Left: PSNR and SSIM comparing to the reference in the NI = 2 data. Error bars show the corresponding standard deviations. **: p-value < 10−2, * * *: p-value < 10−3. Right: PCK curves for fetal landmark detection using a pretrained model.