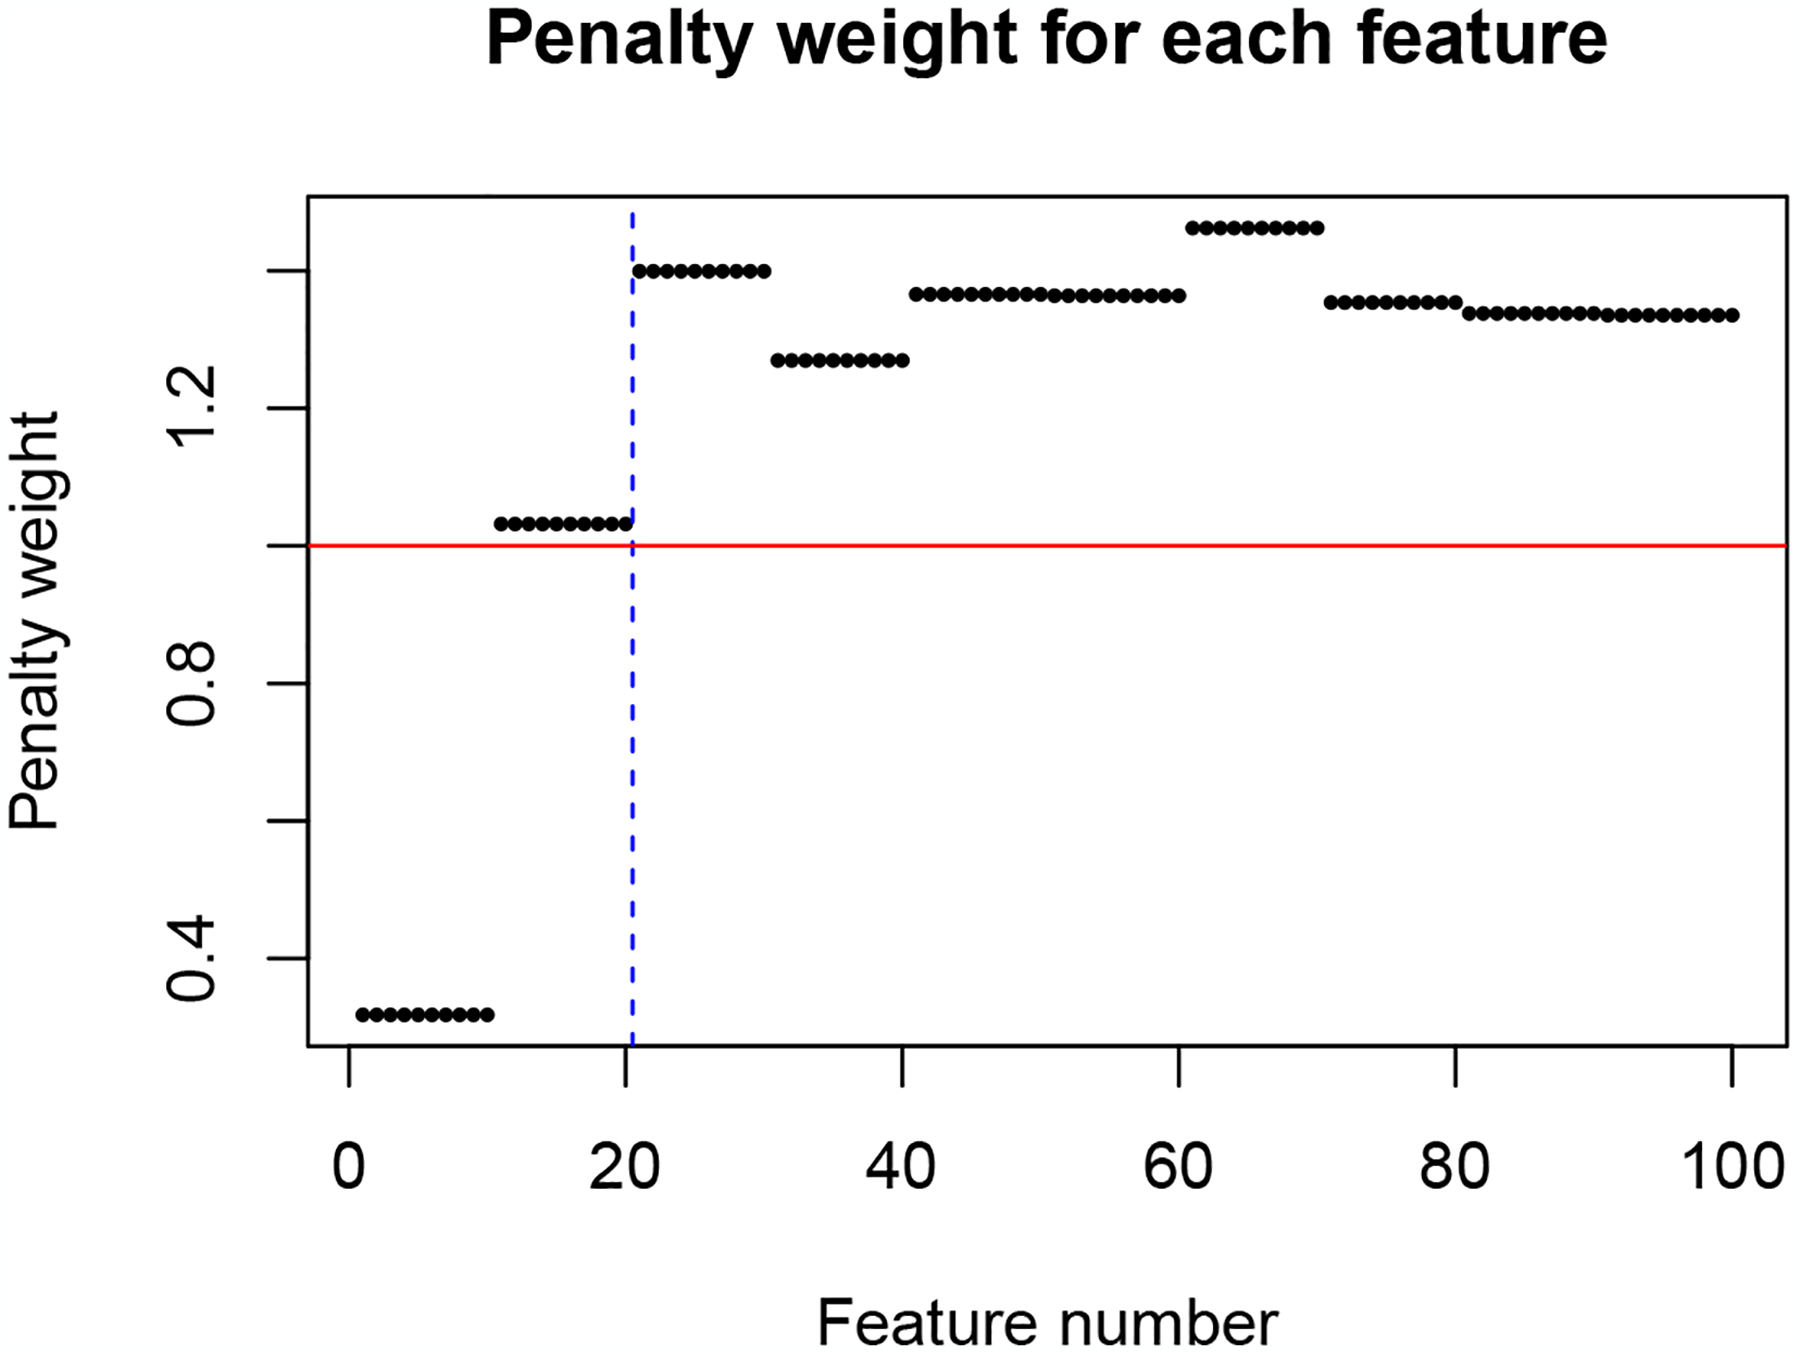
Figure 1:

Penalty factors which fwelnet assigns to each feature. n = 200, p = 100 with features in groups of size 10. The response is a noisy linear combination of the first two groups, with signal in the first group being stronger than that in the second. As expected, fwelnet’s penalty weights for the true features (left of blue dotted line) are lower than that for null features. In elastic net, all features would be assigned a penalty factor of 1 (horizontal red line).
