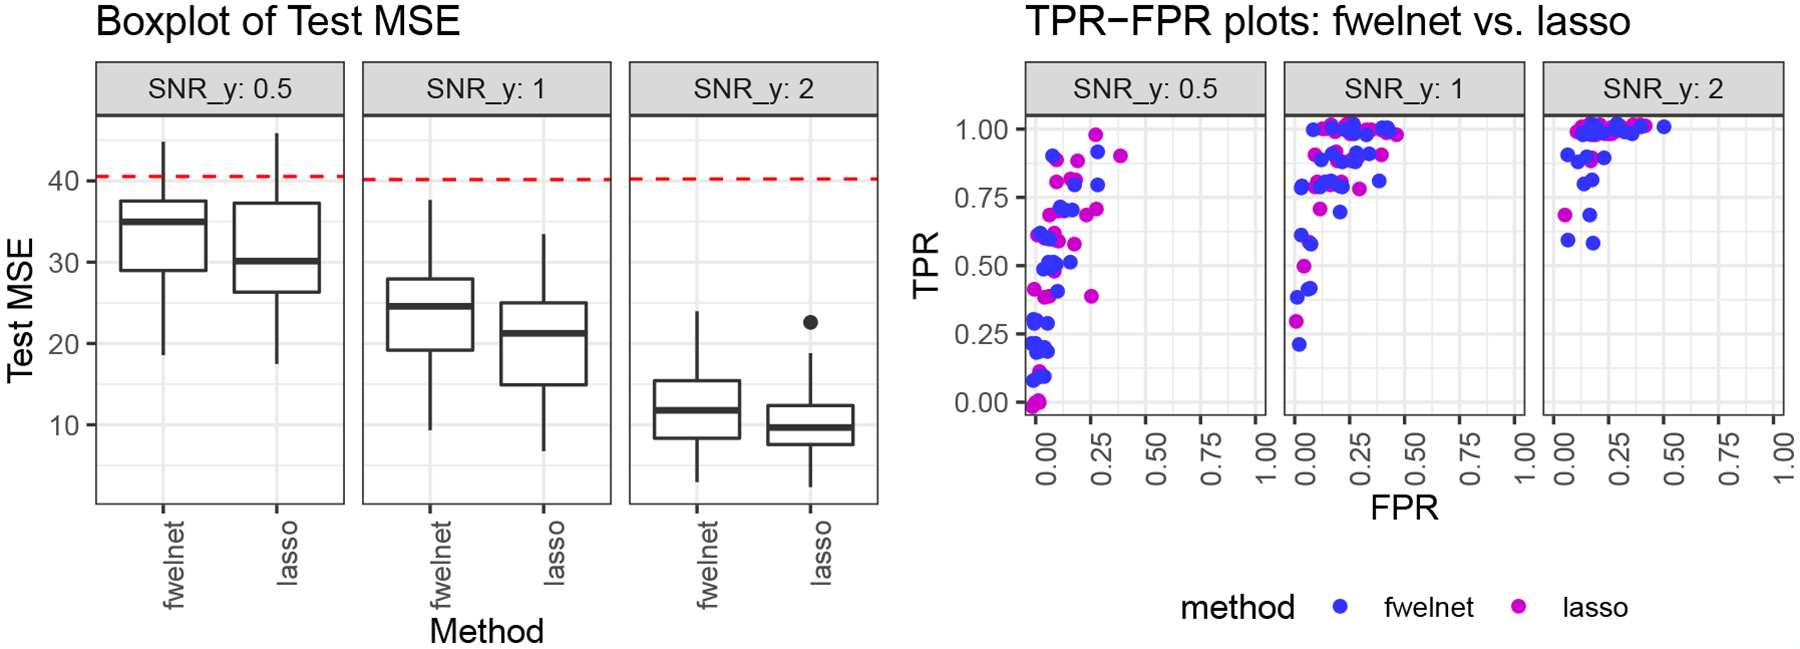
Figure 5:

“Feature of features”: 10 noise variables. n = 100, p = 100. The response is a linear combination of the first 10 features. As we go from left to right, the signal-to-noise ratio (SNR) for y increases. The figure on the left shows the test mean squared error (MSE) results, with the red dotted line indicating the median null test MSE. In the figure on the right, each point depicts the true positive rate (TPR) and false positive rate (FPR) of the fitted model for one of 30 simulation runs. Fwelnet only performs slightly worse than the lasso in test MSE, and has similar TPR and FPR as the lasso.
