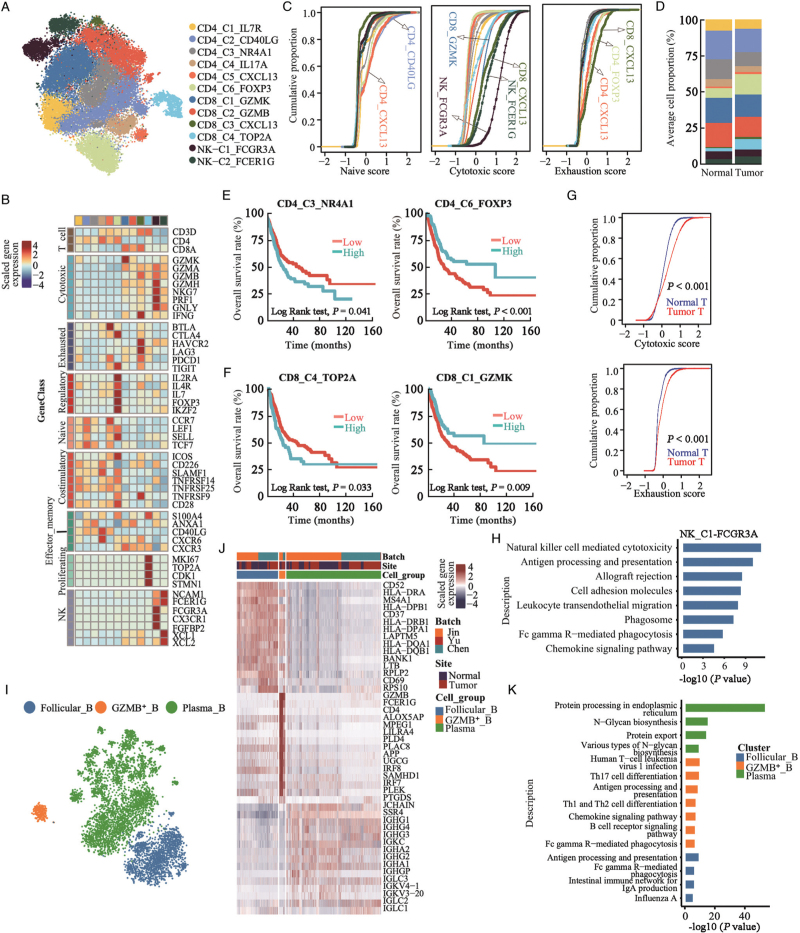
Figure 3.
T/NK and B cell-mediated tumor suppressive activities in urothelial tissues. (A) t-SNE projection of T and NK cells (N = 37,077 cells), colored according to cell clusters. (B) Heatmap of mean expression of functional gene sets in indicated cell clusters. (C) Cumulative distribution function showing distributions of naive, cytotoxic, and exhaustion scores for single T and NK cells. (D) Average proportions of T and NK cell subclusters in tumor (N = 15) and normal (N = 12) urothelial tissues, colored according to cell types. (E) Kaplan-Meier curves for OS among TCGA-BLCA patients (n = 401) with higher or lower CD4_C3_NR4A1 or CD4_C6_FOXP3 cellular proportion. P values from two-sided log-rank test were provided. (F) Kaplan-Meier curves for OS among TCGA-BLCA patients with higher or lower CD8_C4_TOP2A or CD8_C1_GZMK cellular proportion. P values from two-sided log-rank test were provided. (G) Cumulative distribution of cytotoxic and exhaustion scores for CD8+ T cells in normal and tumor urothelial tissues. P value was calculated using two-sided Wilcoxon rank-sum test. (H) Enriched KEGG pathways related to genes with increased expression levels in NK-C1-FCGR3A cells compared to NK-C2-FCER1G cells. (I) t-SNE projections of B cells, colored according to cell cluster. (J) Heatmap showing top 15 differentially expressed genes (DEGs, in row) among the three B cell clusters. (K) Bar plots showing enriched KEGG pathways related to DEGs among B cell types. DEGs: Differentially expressed genes; KEGG: Kyoto Encyclopedia of Genes and Genomes; OS: Overall survival; t-SNE: t-Stochastic neighbor embedding; TCGA-BLCA: The Cancer Genome Atlas-Bladder Endothelial Carcinoma.

