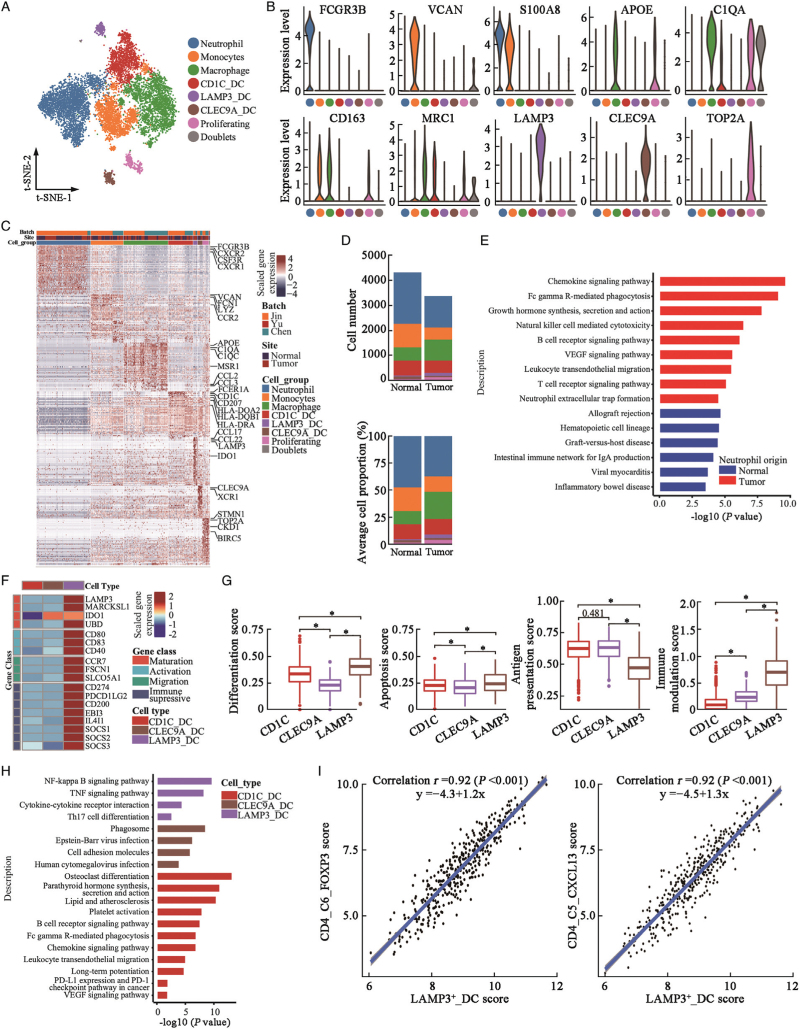
Figure 4.
Diversity of myeloid cells in urothelial tissues. (A) t-SNE projection of myeloid cells (N = 10,973 cells) identified in urothelial tissues, colored by cellular cluster. (B) Violin plots showing expression levels of canonical biomarker genes in each cell subcluster. (C) Heatmap showed the top 50 differentially expressed genes (DEGs, in row) among myeloid cell clusters (columns as indicated). (D) Cell number (upper panel) and average cellular proportion (lower panel) of myeloid cells in tumor (N = 15) and normal (N = 12) urothelial tissues. (E) Bar plot showing enrichment of KEGG pathways of over-expressed genes in neutrophils from tumor tissues compared with normal urothelial tissues. (F) Heatmap showed the normalized mean expression of genes related to DCs maturation, activation, migration and immune modulation activities. Filled color from blue to red indicated low to high expression level. (G) Boxplot showing differentiation, apoptosis, antigen presentation, and immune modulation scores of DC cell subclusters. ∗P < 0.001 from two-sided unpaired Wilcoxon rank-sum test. (H) Bar plot showing enrichment of KEGG pathways of over-expressed genes in each DC cluster. (I) Correlation of cell subcluster-specific score of LAMP3_DC cells and CD4_C6_FOXP3 T-regs or CD4_C5_CXCL13 T cells in TCGA-BLCA patients (N = 401). Coefficient calculated with Pearson correlation analysis. DC: Dendritic cell; DEGs: Differentially expressed genes; KEGG: Kyoto Encyclopedia of Genes and Genomes; t-SNE: t-Stochastic neighbor embedding; TCGA-BLCA: The Cancer Genome Atlas-Bladder Endothelial Carcinoma.

