. 2023 Apr 21;12:e81511. doi: 10.7554/eLife.81511

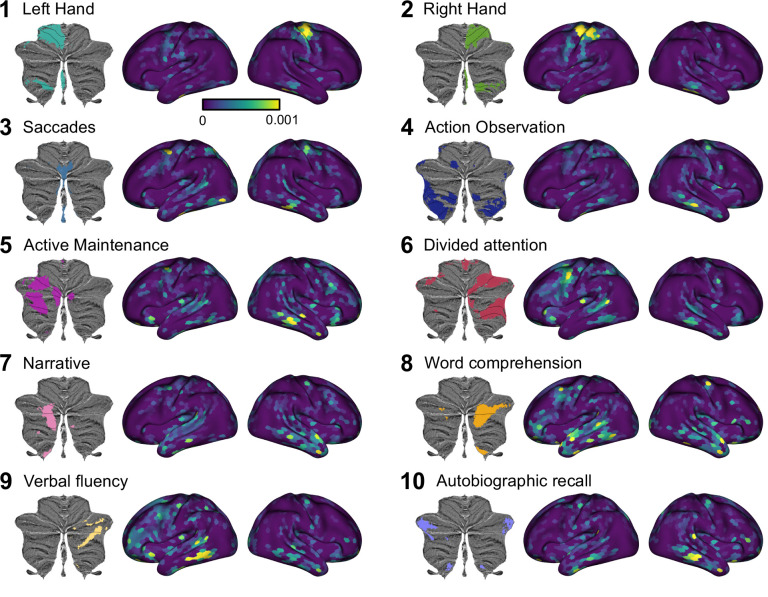
Figure 3. Cortical connectivity weight maps for the Ridge regression model with 1848 cortical parcels for each of 10 functional cerebellar regions.

Each region is denoted by the most important functional term (King et al., 2019). Results are averaged across participants. Regression weights are in arbitrary units. See Figure 3—animation 1 for a gif of the connectivity weight maps, and see Figure 3—figure supplement 1 for the corresponding analysis using Lasso regression. Figure 3 has been adapted from Figure 5 from King et al., 2019.

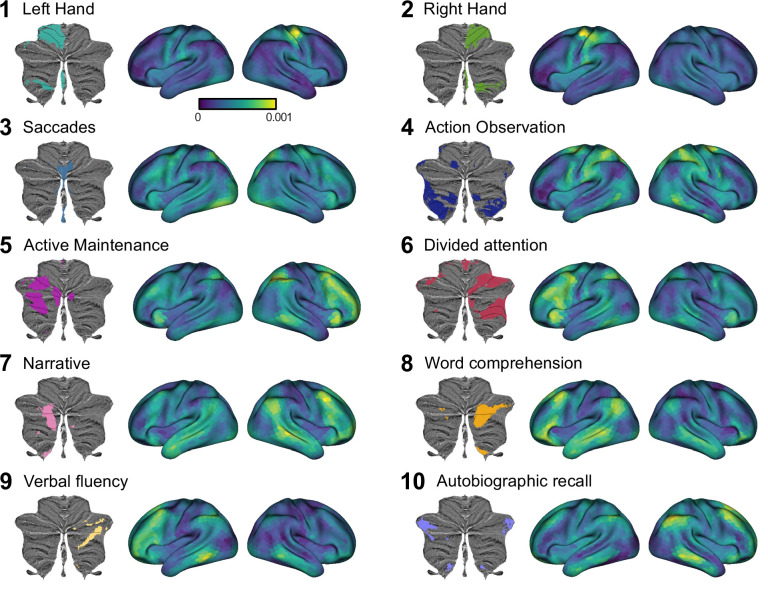
Figure 3.

Figure 3—figure supplement 1. Cortical connectivity weight maps for the Lasso model with 1848 cortical regions.

Figure 3—figure supplement 1.

As in Figure 4, the results are averaged across individuals for each of the 10 functional regions defined on the MDTB data set, with each region denoted by the most important functional term. Results are averaged across participants and voxels within each cerebellar region. Regression weights are in arbitrary units. See Figure 3—animation 2 for a gif of the connectivity weight maps.
Figure 3—animation 1. Animated cortico-cerebellar connectivity maps for the Ridge regression model.
Figure 3—animation 2. Animated cortico-cerebellar connectivity maps for the Lasso regression model.