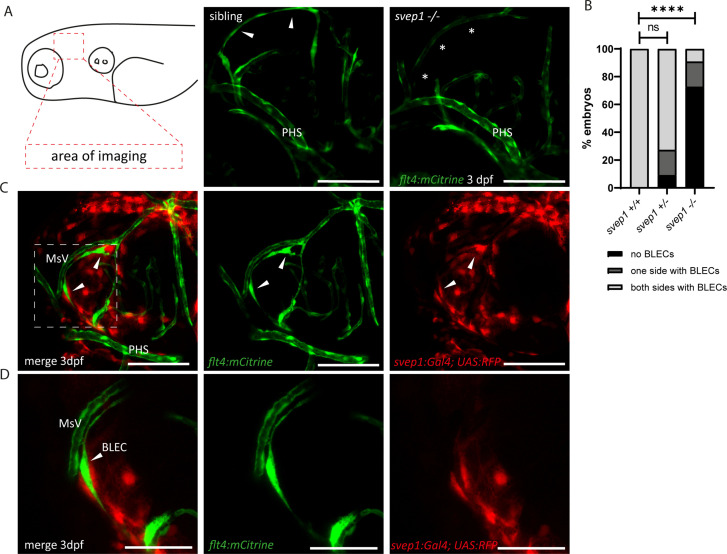
Figure 2. Svep1 is required for the sprouting of BLECs.
(A) Confocal images of sprouting BLECs, marked by flt4:mCitrine, at 3 dpf in svep1 mutants and siblings. Asterisks mark missing BLECs in svep1 mutants. Scale bar = 100 µm. (B) Quantification of BLECs at 3 dpf on each side of the embryo showed that svep1 mutants have significantly less BLECs on one or both sides of the brain hemispheres compared to siblings. For statistical analysis, no BLECs were counted as 0, BLECs being present on only one hemisphere as 1, whereas BLECs being detectable on both brain hemispheres were included as 2, for each embryo (svep1+/+: n = 10; svep1+/−: n = 12; svep1−/−: n = 12). Mann–Whitney test was applied for statistical analysis. Values are presented as means ± standard deviation (SD), ****p < 0.0001, ns = not significant. Scale bar = 100 µm. (C) Confocal images of svep1:Gal4; UAS:RFP, showing svep1 expression immediately adjacent to BLECs, marked by arrowheads, at 3 dpf. Scale bar = 100 µm. (D) Magnification and reduced stack numbers of boxed area in (C). Arrowhead marks BLEC. Scale bar = 50 µm. BLEC, brain lymphatic endothelial cell; dpf, days post-fertilization; MsV, mesencephalic vein; PHS, primary head sinus;.

