Fig. 2.
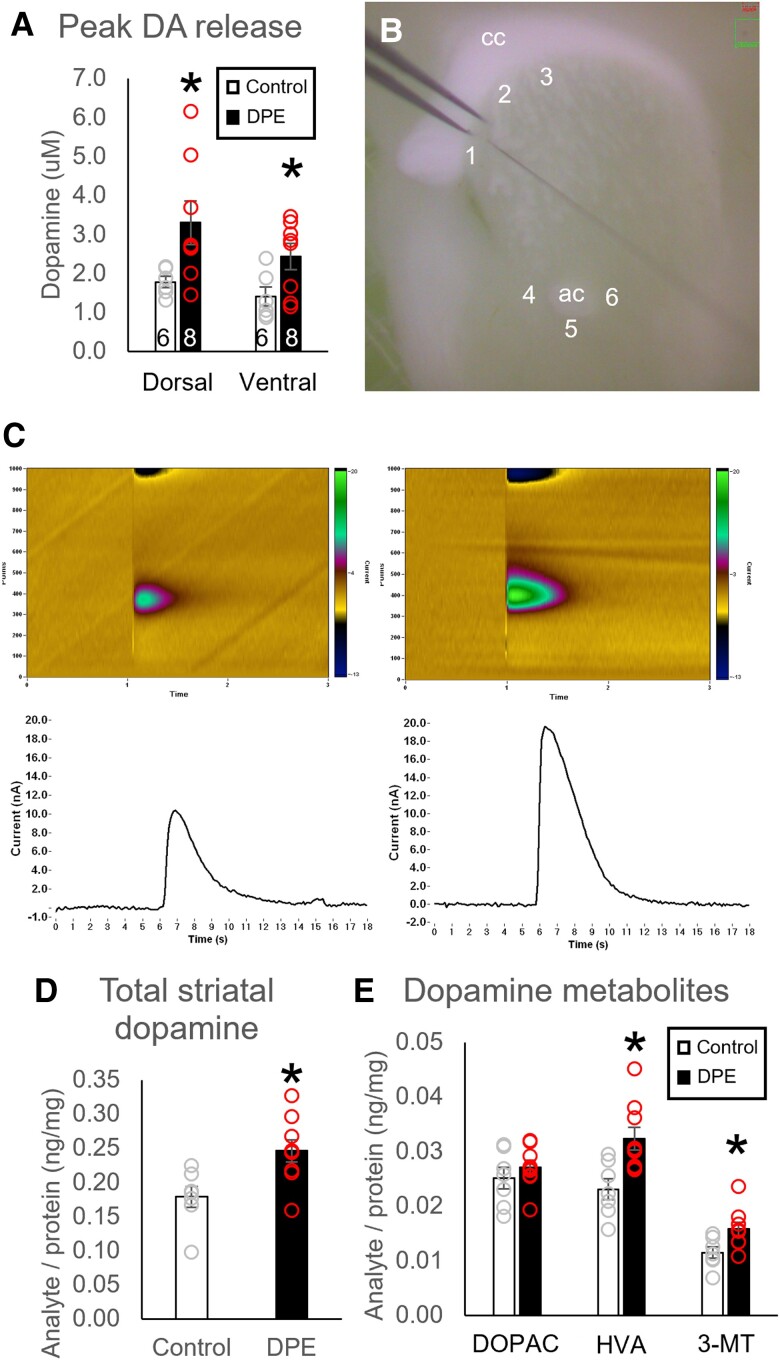
Neurochemical changes in striatal dopamine content and release in DPE mice. A) DPE mice (N = 8) showed a higher peak of stimulated dopamine release than control mice (N = 6) in both the dorsal and ventral striata. B) A representative image shows placement of the stimulating and recording electrodes for cyclic voltammetry in the dorsal striatum (sites 1–3) and ventral striatum (sites 4–6). C) Representative cyclic voltammetry color plots and amperograms for the ventral striatum of control mice (Left) and DPE mice (Right). D) Total striatal dopamine and E) two out of three dopamine metabolites were elevated in DPE mice (N = 9) relative to controls (N = 7). *P < 0.05 by t test. cc, corpus callosum; ac, anterior commissure.

