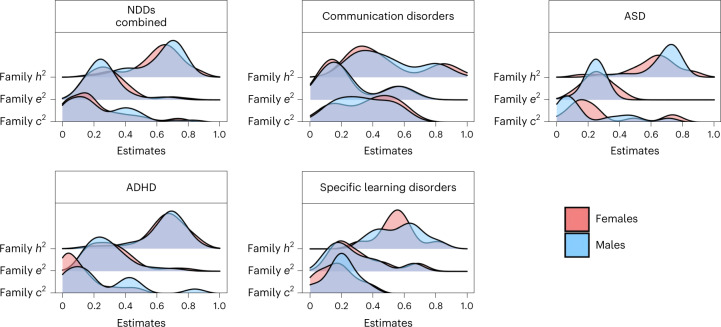
Fig. 5. Sex differences.
Distributions of the sex-specific meta-analytic estimates for the heritability (h2) of NDDs and environmental contributions to NDDs. The top left panel shows the distributions of sex-specific estimates for the transdiagnostic meta-analysis; the remaining panels show the same estimates for specific NDDs for which a sufficient number of studies (>2) reporting sex-specific estimates was identified. The results for sex-specific c2, e2, rC and rE estimates are presented in Supplementary Note 1.

