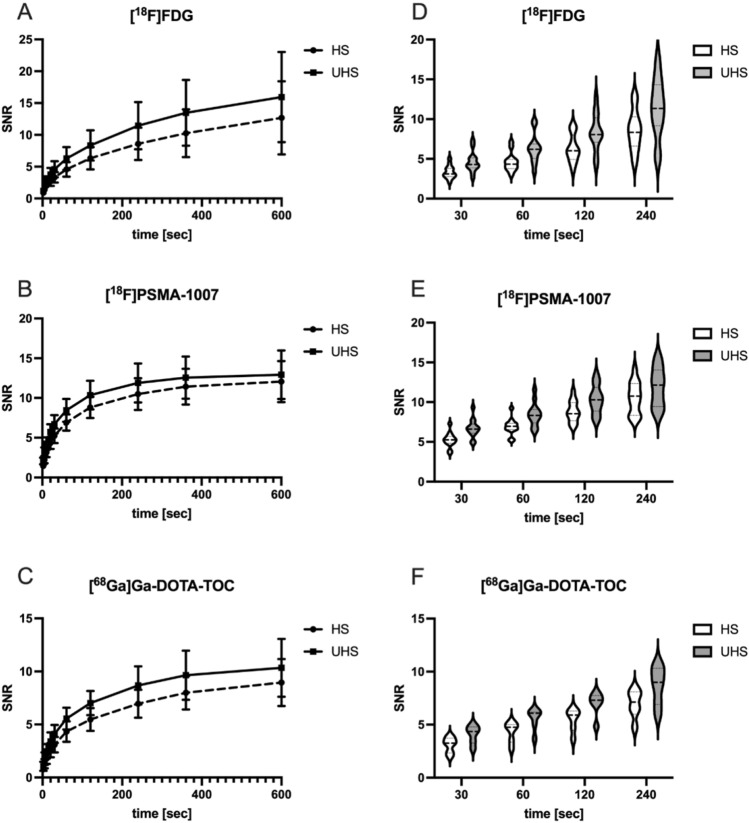
Fig. 3.
Signal-to-noise ratios (SNR) of all three radiopharmaceuticals in high sensitivity (HS) and ultra-high sensitivity reconstruction (UHS) as reciprocal coefficient of the variance (COV). Given are the SNR in all three radiopharmaceuticals for 2 s, 5 s, 10 s, 20 s, 30 s, 60 s, 120 s, 240 s, 360 s and 600 s acquisition time (A–C). All SNR of UHS were significantly higher to HS mode. Shown are mean ± SD. Comparable SNR could be found between 30 s UHS and 60 s HS, between 60 s UHS and 120 s HS and between 120 s UHS and 240 s HS in all three radiopharmaceuticals as visualised in the violin plots (D–F)

