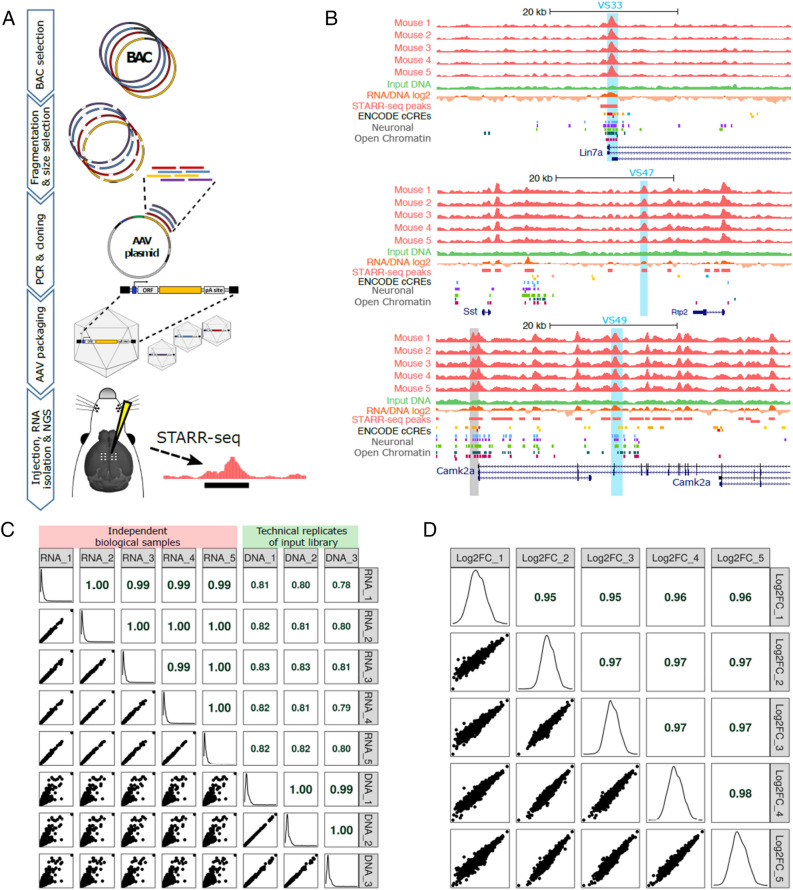
Figure 1.
An AAV-STARR-seq screen in mouse brain. (A) Schematic illustrating AAV-STARR-seq screening procedure. (B) UCSC genome browser screenshots of three example regions, showing the STARR-seq RNA from 5 mice and the input library DNA (merged from the 3 technical replicates). The blue highlighted regions were further evaluated in this study. The grey highlighted region shows the 1.2 kb Camk2a promoter region from Dittgen et al.61 used in commercially available AAV2 constructs (Addgene plasmid # 22908). The ENCODE cCRE track shows enhancers (orange), promoters (red) and insulators (blue) identified by the ENCODE project in various mouse tissues and cell types. Neuronal Open Chromatin tracks are from Gray et al.35, for mouse visual cortex layer-specific excitatory neurons from layers 2/3 (light blue), 4 (purple), 5 (light green), and 6 (dark green), and GABAergic neurons from all layers (dark red). (C) Pairwise scatter plots and Pearson correlation coefficients for all independent biological RNA samples from the five mice and the three technical replicates from the AAV-STARR-seq library DNA used as input for the screen, based on 1 kb bins tiled across the BAC regions. The diagonal plots show the expression distributions of the 1 kb bins per sample. (D) Pairwise scatter plots and Pearson correlation coefficients for the STARR-seq signal (RNA/input DNA log2 fold change) across all mice.

