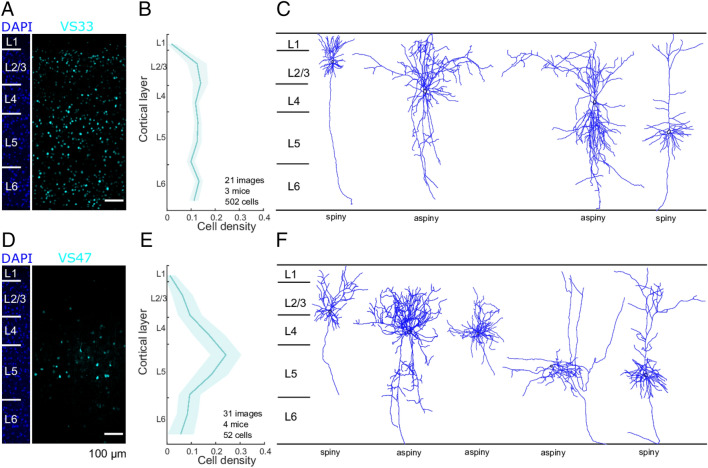
Figure 5.
Cortical layer distribution and neuronal morphology of validation sequences VS33 and VS47 in coronal sections of the auditory cortex. (A, D) Example fluorescence microscopy image of a cortical slice depicting mTFP expression driven by VS33 (A) or VS47 (D). Six neocortical layers indicated on DAPI image. (B, E) Distribution of mTFP-expressing cells across cortical layers (mean across images ± SD) for VS33 (B) or VS47 (E). VS33 does not show layer-specificity, but VS47 drives expression mainly in layer5 of the cortex. (C, F) Example cell morphology tracings of neurons expressing EYFP after recombination byVS33-driven (C) or VS47-driven (F) Cre-recombinase. Both sequences drive expression in diverse morphological cell types.

