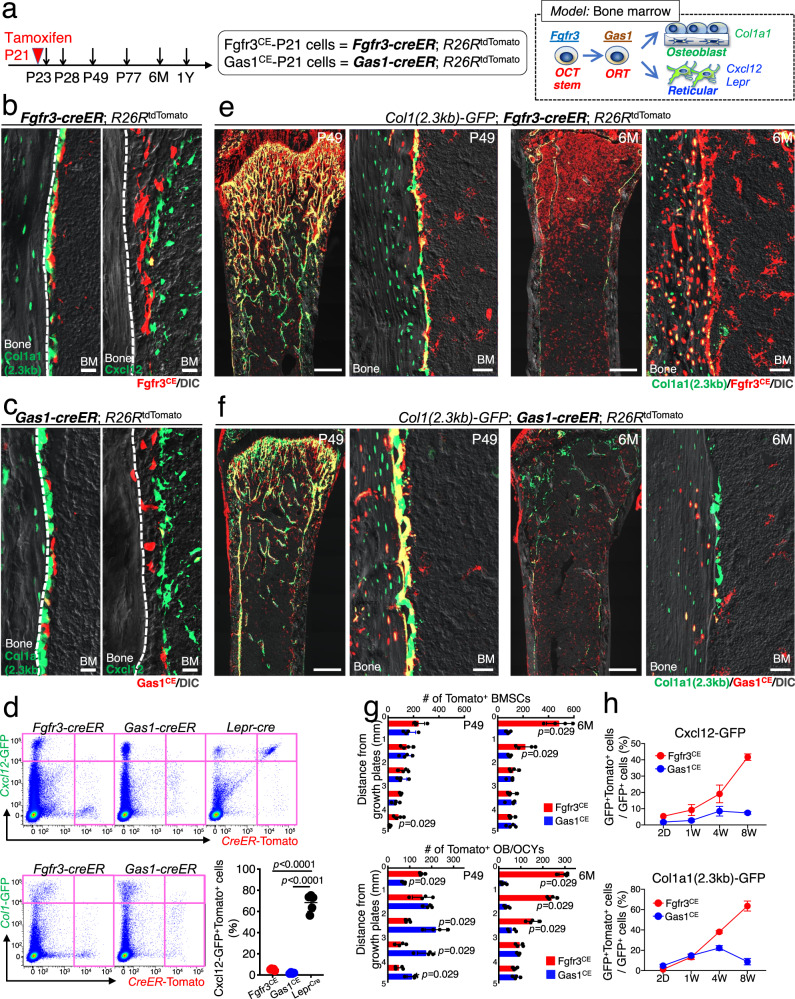
Fig. 4. Robust osteogenic capabilities of Fgfr3+ endosteal stromal cells in homeostasis.
a Diagram of lineage-tracing analyses of Fgfr3-creER+ and Gas1-creER+ cells. Right: a proposed model of bone marrow stromal cell differentiation. b, c Fgfr3-creER; R26RtdTomato (b) and Gas1-creER; R26RtdTomato (c) femur endosteal space at P23 (pulsed at P21) with Col1a1-GFP (left) and Cxcl12-GFP (right). Scale bar: 20 µm. n = 4 mice per each group. BM: bone marrow. d Flow cytometry analysis of CD45/Ter119/CD31neg bone marrow cells isolated from Fgfr3-creER; R26RtdTomato (left) and Gas1-creER; R26RtdTomato femurs (center) with Cxcl12-GFP (upper) or Col1a1-GFP (lower) at P23 (pulsed at P21). Cxcl12GFP/+; Lepr-cre; R26RtdTomato femurs at P21 (upper right) Lower right panel: Percentage of tdTomato+ cells among Cxcl12-GFP+ cells (tdTomato expression induced by Fgfr3-creER, Gas1-creER, or Lepr-cre). Two-tailed, one-way ANOVA followed by Tukey’s multiple comparison test. n = 5 (Fgfr3CE), n = 4 (Gas1CE), n = 5 (Leprcre) mice. e, f Col1a1-GFP; Fgfr3-creER; R26RtdTomato (e) and Col1a1-GFP; Gas1-creER; R26RtdTomato (f) distal femurs at P49 and 6M (pulsed at P21). Scale bar: 500 µm (left and center right), 20 µm (center left and right). n = 4 mice per each time point. BM: bone marrow. g Quantification of tdTomato+ bone marrow stromal cells (upper) and osteoblasts and osteocytes (lower) in marrow space at P49 and 6M, aligned based on distance from the growth plate. Fgfr3CE-tdTomato+ cells (red), Gas1CE-tdTomato+ cells (blue). n = 4 mice per each group. Two-tailed, Mann–Whitney’s U-test. h Flow cytometry analysis of CD45/Ter119/CD31neg bone marrow cells after 2 days, 1 week, 4 weeks, and 8 weeks of chase (pulsed at P21), isolated from Fgfr3-creER; R26RtdTomato (red line) or Gas1-creER; R26RtdTomato femurs (blue line). Percentage of lineage-marked tdTomato+ cells among Cxcl12-GFP+ cells (upper) and Col1a1-GFP+ cells (lower). n = 3 mice for Col1a1-GFP/Fgfr3-creER at P49 and P77, Col1a1-GFP/Gas1-creER at P23, Cxcl12-GFP/Fgfr3-creER at P77, Cxcl12-GFP/Gas1-creER at P49), n = 4 mice for Col1a1-GFP/Fgfr3-creER at P23 and P28, Col1a1-GFP/Gas1-creER at P28 and P49, Cxcl12-GFP/Fgfr3-creER at P28, Cxcl12-GFP/Gas1-creER at P23, P28, and P77, n = 5 mice for Col1a1-GFP/Gas1-creER at P77, Cxcl12-GFP/Fgfr3-creER at P23 and P49). Data were presented as mean ± s.d. Exact P value is indicated in the figures. Source data are provided as a Source Data file.

