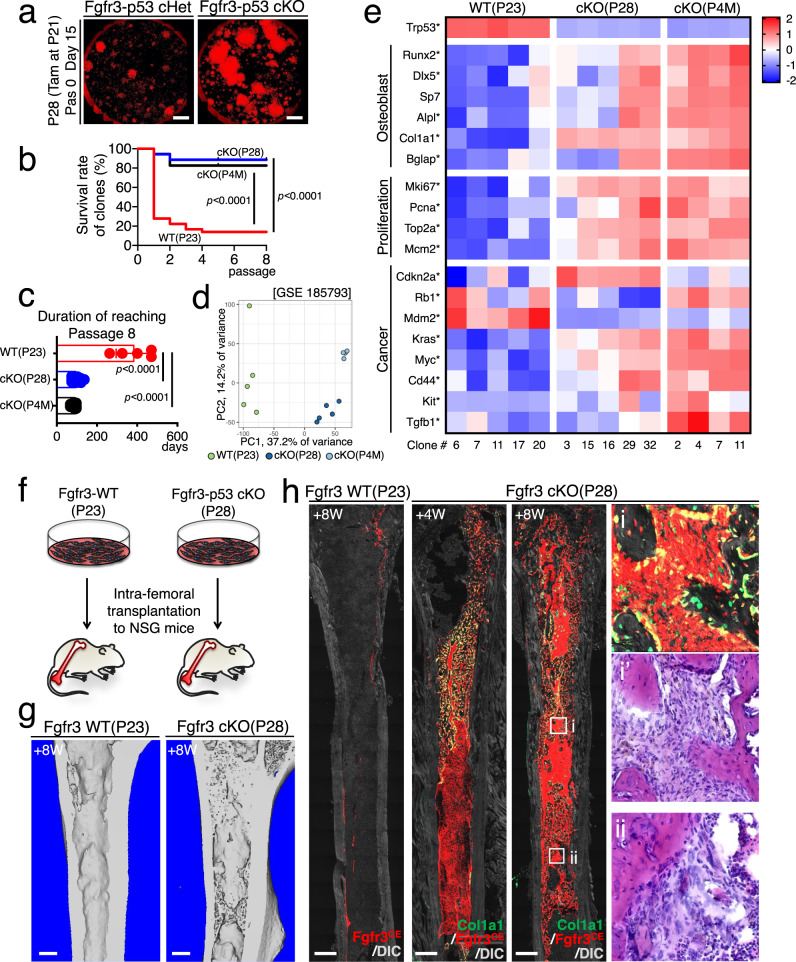
Fig. 9. Unregulated self-renewal and aberrant osteogenic fates of tumorigenic Fgfr3+ endosteal stem cells.
a CFU-F assay of Fgfr3-p53 cHet and Fgfr3-p53 cKO bone marrow cells at P28 (pulsed at P21). Scale bar: 5 mm. n = 4 mice per each group. b Survival curve of individual tdTomato+ clones over serial passages among Fgfr3-WT (P23, red), Fgfr3-p53 cKO (P28, blue), and Fgfr3-p53 cKO (P4M, black). n = 36 (Fgfr3-WT P23), n = 35 (Fgfr3-p53 cKO P28), n = 18 (Fgfr3-p53 cKO P4M) clones. Log-rank (Mantel–Cox) test. c Duration to reach Passage 8. n = 5 (Fgfr3-WT P23), n = 29 (Fgfr3-p53 cKO P28), n = 12 (Fgfr3-p53 cKO P4M) clones. Two-tailed, one-way ANOVA followed by Tukey’s multiple comparison test. d, e Comparative bulk RNA-seq analysis of individual tdTomato+ clones, Fgfr3-WT (P23, n = 5 clones), Fgfr3-p53 cKO (P28, n = 5 clones) and Fgfr3-p53 cKO (P4M, n = 4 clones) clones. d Principal component analysis (PCA) plot of Fgfr3-WT (P23, light green), Fgfr3-p53 cKO (P28, blue) and Fgfr3-p53 cKO (P4M, light blue) clones. x-axis: PC1, 37.2% variance, y-axis: PC2, 14.2% variance. e Heatmap of representative differentially expressed genes (DEGs) associated with osteoblast differentiation, cell proliferation, and osteosarcomagenesis. Star: statistically significant difference among the three groups. n = 4 (Fgfr3-p53 cKO P4M), n = 5 (Fgfr3-WT P23, Fgfr3-p53 cKO P28) mice. A two-sided t-test, based on a beta-negative binomial distribution, was used to calculate the p values (corrected for multiple testing) with an FDR cutoff of 0.05 to identify DE for the bulk RNA-seq data. f Diagram of intrafemoral transplantation of individual Fgfr3-WT (P23) and Fgfr3-p53 cKO (P28) tdTomato+ clones to NSG recipient mice. g 3D-μCT of Fgfr3-WT (P23) and Fgfr3-p53 cKO (P28) transplanted femurs after 8 weeks of transplantation. Scale bar: 500 µm. n = 4 per each group. h Histology of recipient femurs. (Left): Transplantation of Fgfr3-WT (P23) clones after 8 weeks of transplantation. (Left center): Transplantation of Fgfr3-p53 cKO (P28) clones after 4 weeks (left center) and 8 weeks (right center) of transplantation. (Right): Magnified views of highly-trabecularized areas in recipient bone marrow, fluorescent, and H&E staining (right). Scale bar: 500 µm. n = 4 per each group. Data were presented as mean ± s.d. Exact P value is indicated in the figures. Source data are provided as a Source Data file.

