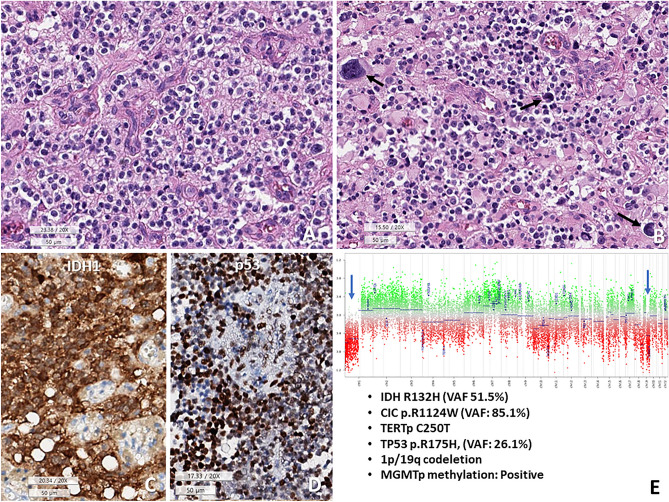
Figure 3.
The second case of TP53 mutant oligodendroglioma, CNS WHO grade 3. (A) Tumor shows fried egg-appearing monotonous round cells with microvascular proliferation. (B) Some tumor cells have pleomorphic and hyperchromic nuclei (arrows) and abundant eosinophilic cytoplasm. This photo is a little bit out of focus because of nearby calcifications. (C,D) These tumor cells are positive for IDH1 (H09) and P53. (E) Copy number variation plots obtained from methylation profiles represent 1p/19q codeletion (one copy deletion). In addition, CIC (p.R1124W, VAF: 85.1%), TERT promoter (C250T), TP53 (p.R175H, VAF: 26.1%) mutations and MGMT promoter methylation are present (A,B H&E, C IDH1 IHC, D p53 IHC, E CNV plot, under bar sizes A–D 50 micrometer).

