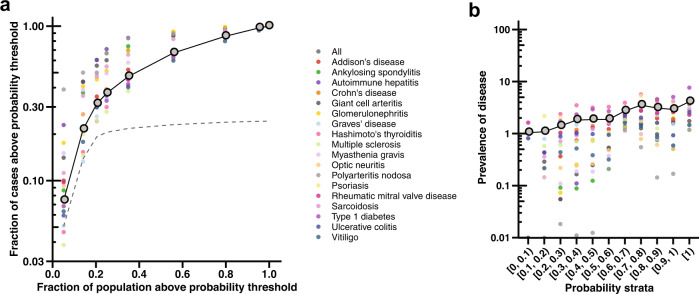
Fig. 3. Model performance in capturing diverse autoimmune conditions.
a Fraction of cases diagnosed with one of 18 autoimmune conditions above a probability threshold on a base-10 logarithmic scale versus the fraction of individuals that are tested for autoantibodies at the equivalent probability threshold. The dashed line marks the fraction of tested individuals above each probability threshold. The gray point indicates the mean across all autoimmune conditions. The columns of points represent values at different probability thresholds decreasing from left (≥0.9) to right (≥0.1) by increments of 0.1; the most lenient threshold (≥0.1) at the farthest right column of points yields the greatest fraction of individuals with autoimmune conditions detected by the model and the greatest fraction of the population tested. b Prevalence of autoimmune conditions on a base-10 logarithmic scale in different strata of probabilities increasing from 0 to 0.1 [0, 0.1) through 1.

