
Fig. 4. Obesity leads to increased IP3R expression and CaMKII phosphorylation in adipose tissue.
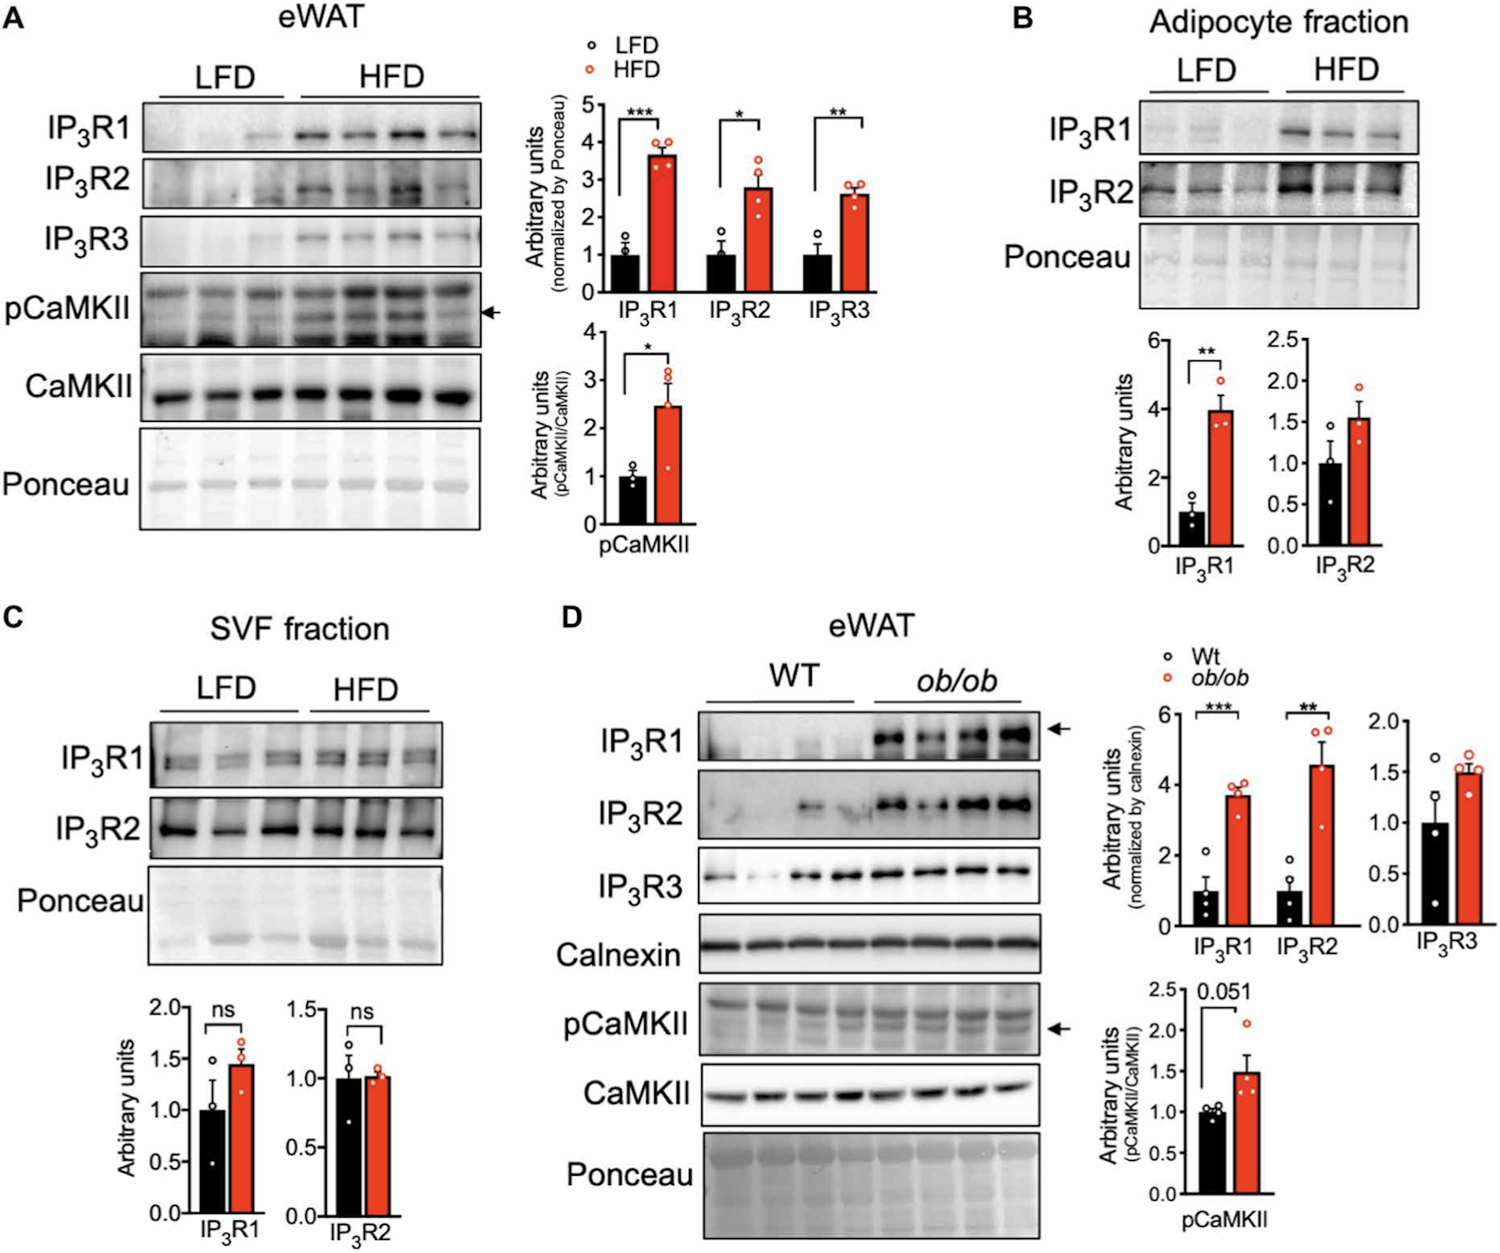
(A) Left: Immunoblot analysis of protein expression and phosphorylation levels in epididymal WAT (eWAT) from mice fed a low-fat diet (LFD) or a high-fat diet (HFD) for 16 weeks. Right: Western blot quantification. n=3 mice LFD and 4 mice HFD. *P<0.05; **P<0.005; ***P<0.001. (B and C) Left: Immunoblot analysis of protein expression in adipocyte fraction and stromal vascular fraction (SVF) derived from eWAT from mice fed LFD or HFD for 16 weeks. n=3 mice per group. Right: Western blot quantification. n=3 mice per group. *P<0.05. ns, not significant. (D) Left: Immunoblot analysis of protein expression and phosphorylation levels in eWAT from WT and leptin-deficient (ob/ob) mice. Right: Western blot quantification. n=4 mice per group. **P<0.005; ***P<0.0005. The experiments in this figure were replicated in two independent mice cohorts.