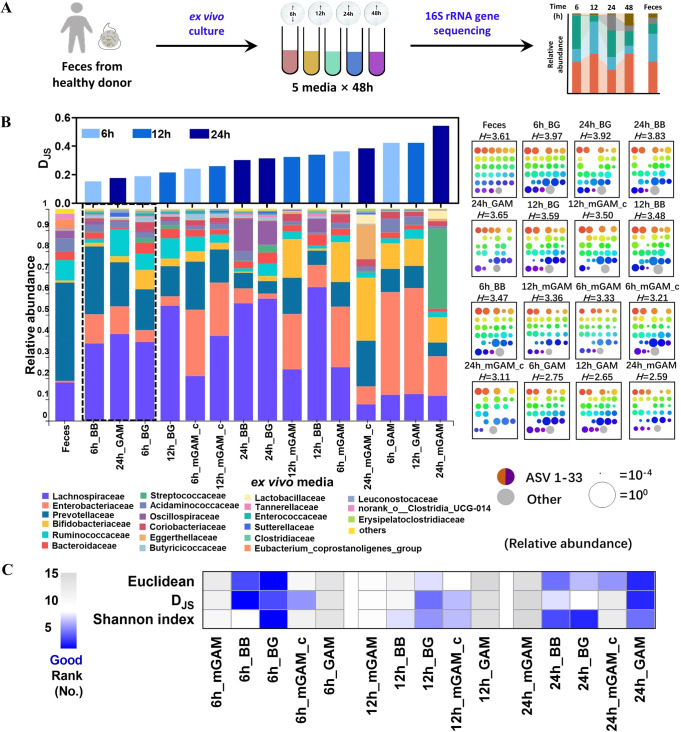
Fig. 1. Investigation of culture time for human-fecal samples.
A Flow chart of the experiment B Family level bacterial composition of the sample (left), including original fecal sample and its ex vivo cultures, grown anaerobically in 5 different media at incubation time of 6,12, and 24 h. Cultures are ordered according to their Jensen-Shannon divergence (DJS) from the original fecal sample (upper axes, computed at the family level). ASV level bacterial composition of the sample (right), where each square represents one sample. Rainbow colored dots represent the relative abundance of individual ASVs. Samples are ordered by their Shannon index at the ASV level, computed in base 2 and shown above each square. C Comprehensive rank of 15 cultures, which are ordered according to the Euclidean (ASV level) and DJS (family level) from the original fecal sample (rank from 1 to 15 in ascending order), and the Shannon index (rank from 1 to 15 in descending order), the smaller rank indicates higher similarity and diversity.

