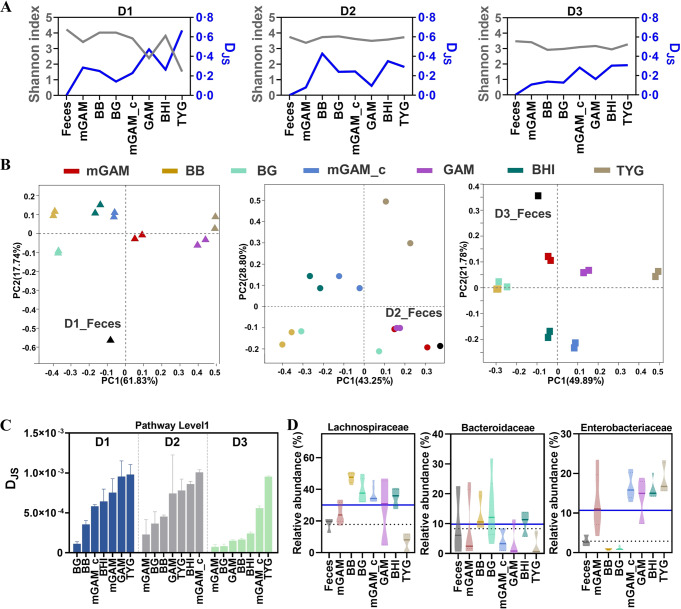
Fig. 3. Screening of different culture media.
A Shannon index at the ASV level and DJS at the family level. B Bray curtis based Principal co-ordinates analysis (PCoA) among the samples at genus level. C DJS from the fecal sample, computed at the pathway level 1. D Abundance of top 3 gut microbiota at the family level (dashed line means the abundance of gut microbiota in fresh feces, solid line means the average abundance of gut microbiota in 7 media).

