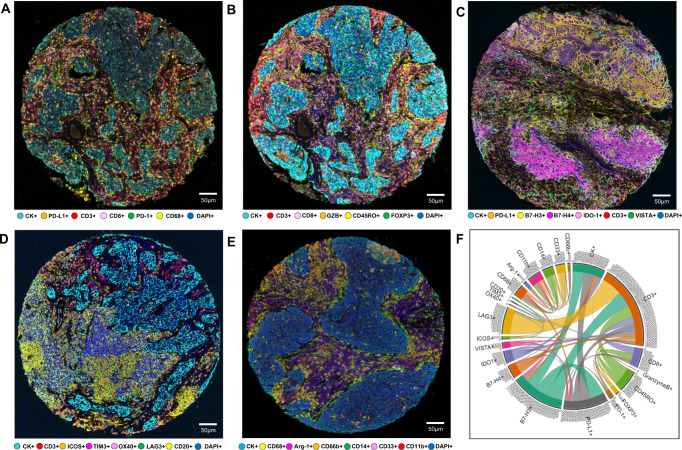
Fig. 1. Representative examples of multispectral images from non-small cell lung cancer tissue microarray specimens, with their chord diagram of the markers.
Composite spectral mixing images from multiplex immunofluorescence (mIF; 20× magnification, scale bars represent 50 µm on each image) is shown for (A) panel 1: cytokeratin (CK), CD3, CD8, PD-1, PD-L1, and CD68; (B) panel 2: CK, CD3, CD8, CD45RO, granzyme B (GZB), and FOXP3; (C) panel 3: CK, CD3, PD-L1, B7-H3, B7-H4, IDO-1; and VISTA; (D) panel 4: CK, CD3, ICOS, LAG3, OX40, TIM3, and CD20; (E) panel 5: CK, Arg-1, CD11b, CD14, CD33, CD66b, and CD68. F Chord diagram visualization showing the diversity of inter-relationships between markers’ co-expression, including all the markers in the five mIF panels. Data from 225 samples was used. Experiments and quantifications related to the presented results were conducted once. The images were generated using Vectra-Polaris 1.0.13 scanner system and InForm 2.4.8 image analysis software (Akoya Biosciences). The chord diagram was generated using all tumor cores from all mIF panels by R studio software version 3.6.1. (Source data is provided as a source data file).

