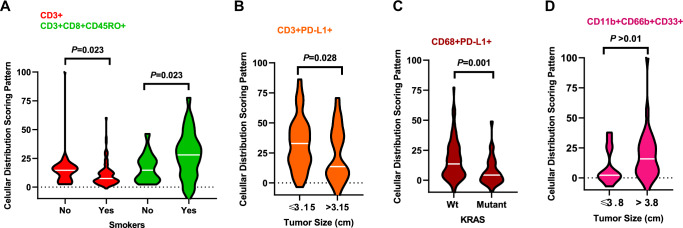
Fig. 4. Violin plots showing associations between patterns of immune cell distribution and clinicopathologic features.
Significant cellular distribution scoring patterns between immune cells and malignant cells are shown by (A) smoker status, (B) tumor size, and (C) KRAS mutation status for lung adenocarcinoma (n = 142) specimens. D Significant cellular distribution scoring patterns between malignant cells and immune cells are shown by tumor size for lung squamous cell carcinoma (n = 83) specimens. Violin plots showing the median bar value, lower adjacent value and outside points. Kruskal–Wallis test was used in A–D comparisons between groups. Data from 225 samples was used. Graphs were generated using GraphPad Prism v.9.0.0 using the 26 cell phenotypes distribution patterns and the relevant clinicopathologic information using un-adjusted P-values. (Source data is provided as a source data file).

