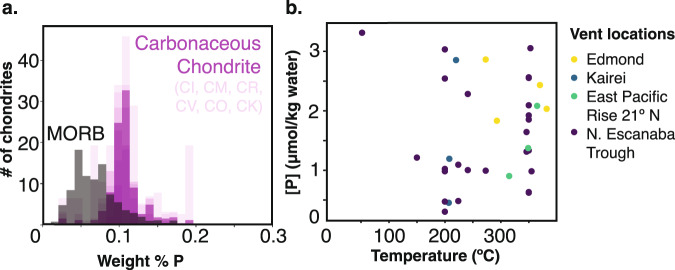
Fig. 1. Phosphorus abundances in chondrites, basalts, and hydrothermal fluids.
a Histogram of phosphorus concentrations (wt%) for all carbonaceous chondrite compositions in the chondrite database23 (n = 1800) and Mid Ocean Ridge Basalt database26 (n = 3598). All chondrite compositions are depicted at 10% opacity to highlight the large degree of overlap among different chondrite classes. b Phosphorus concentrations from the submarine hydrothermal vent database (n = 34)38.

