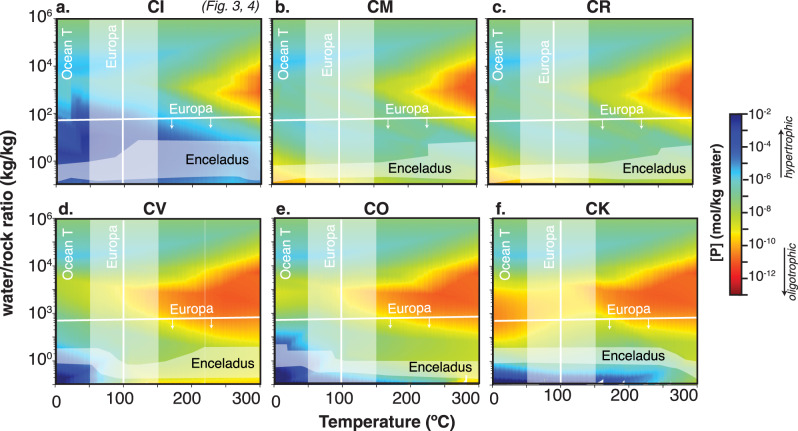
Fig. 2. Total dissolved phosphate concentration (mol/kg) for averaged carbonaceous chondrite composition for different chondrite classes and mid-ocean ridge basalts with 0–2 wt% C.
a–c CI, CM, CR are closer to solar stoichiometry and d–f CV, CO, CK have higher Ca concentrations. For comparison with Europa, vertical lines are inferred from hydrothermal models35 and the horizontal line is the lower bound on water/rock ratio inferred from salinity estimates13. For comparison with Enceladus, shaded regions show estimates from Si nanoparticles11 while horizontal lines track modeled [Na] corresponding to observations of NaCl observed in the E-ring10 (additional pH constraints Fig. 3).

