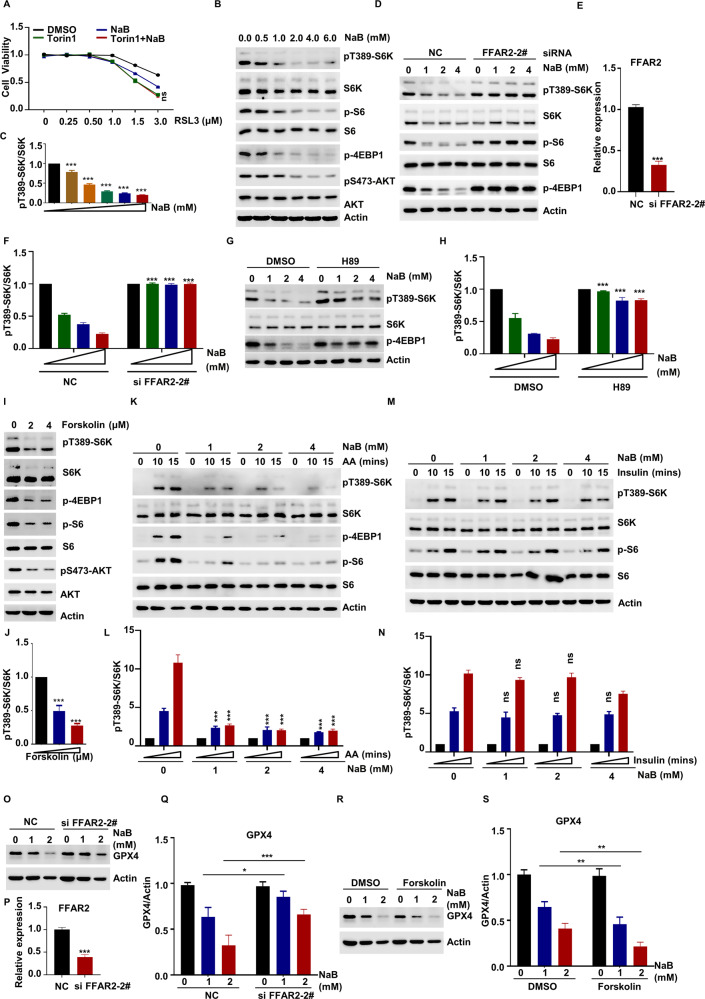
Fig. 6. Promotion of ferroptosis by butyrate via inhibition of the AKT and mTORC1 pathway in a cAMP-PKA-dependent manner.
A HT29 cells were treated with different concentrations of RSL3 or in combination with NaB and Torin1 for 6 h, the cell viability was examined using CCK-8. HT29 cells were treated with the indicated concentrations of NaB for 6 h, then WB was used to evaluate the levels of pT389-S6K and indicated proteins (B), and quantitative data for pT389-S6K/S6K is presented (C). D–F FFAR2-knockdown HT29 cells were treated with the indicated concentrations of NaB for 6 h, and then WB was used to evaluate the levels of pT389-S6K and indicated proteins (D). The knockdown efficiency was measured by qRT-PCR (E) and quantitative data for pT389-S6K/S6K is presented (F). HT29 cells were treated with NaB or in combination with H89 for 6 h, then WB was used to evaluate the levels of pT389-S6K and indicated proteins (G), and quantitative data for pT389-S6K/S6K is presented (H). HT29 cells were treated with the indicated concentrations of Forskolin for 6 h, then WB was used to evaluate the levels of pT389-S6K and indicated proteins (I), and quantitative data for pT389-S6K/S6K is presented (J). HT29 cells were stimulated with amino acid (K, L) or insulin (M, N) for the indicated time after pretreatment with indicated concentrations of NaB for 6 h, then WB was used to evaluate the levels of pT389-S6K and indicated proteins (K, M), and quantitative data for pT389-S6K/S6K are presented (L, N). O–Q FFAR2-knockdown HT29 cells were treated with the indicated concentrations of NaB for 6 h, and the protein level of GPX4 was measured using WB (O). The knockdown efficiency was measured by qRT-PCR (P) and quantitative data for GPX4 protein levels were presented (Q). HT29 cells were treated with indicated concentrations of NaB or in combination with Forskolin for 6 h, and the protein level of GPX4 was measured using WB (R), quantitative data for GPX4 protein levels were presented (S).

