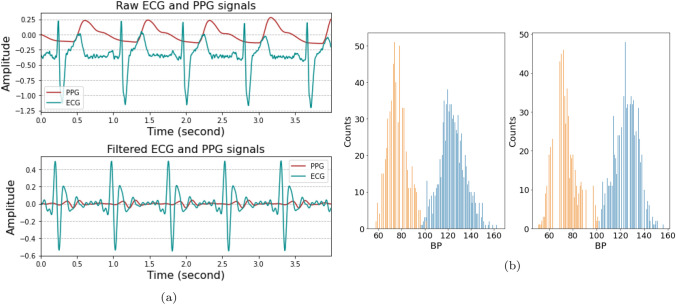
Fig. 3.
The data used for estimation of the BP. a the pre-processing of the input data. The top one denotes the raw signals and the bottom one denotes after band-pass filtering to remove baseline drift and noise. b the blood pressure distribution. The left one is the distribution of the arm BP and the right one is wrist BP

