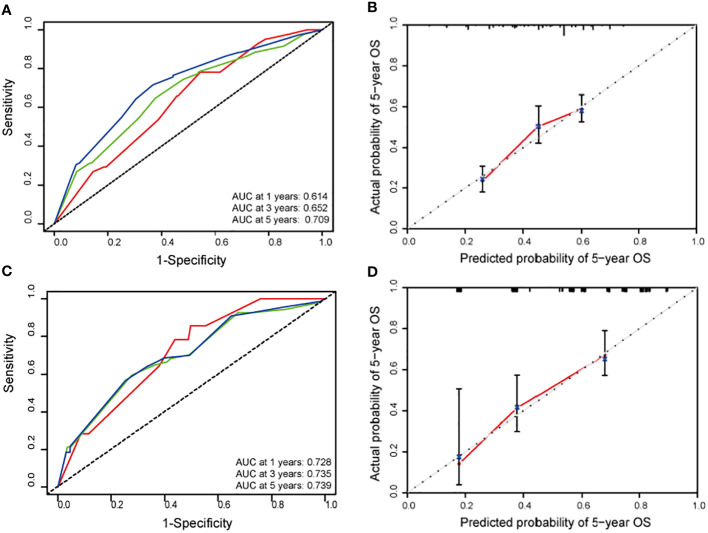
Figure 2.
(A) Receiver operating characteristic (ROC) curves for 1-(red line), 3-(green line) and 5-year (blue line) overall survival (OS) according to the training cohort (TC) nomogram. (B) Calibration plot for predicting survival at 5-year in the TC nomogram. (C) ROC curves for 1-(red line), 3-(green line) and 5-year (blue line) OS according to the validation cohort (VC) nomogram. (D) Calibration plot for predicting survival at 5-year in the VC nomogram.

